Industrial Properties
916 South 18th Street Harrisburg, PA 17104
916 South 18th Street Harrisburg, PA 17104
Details & Description
Property Highlights
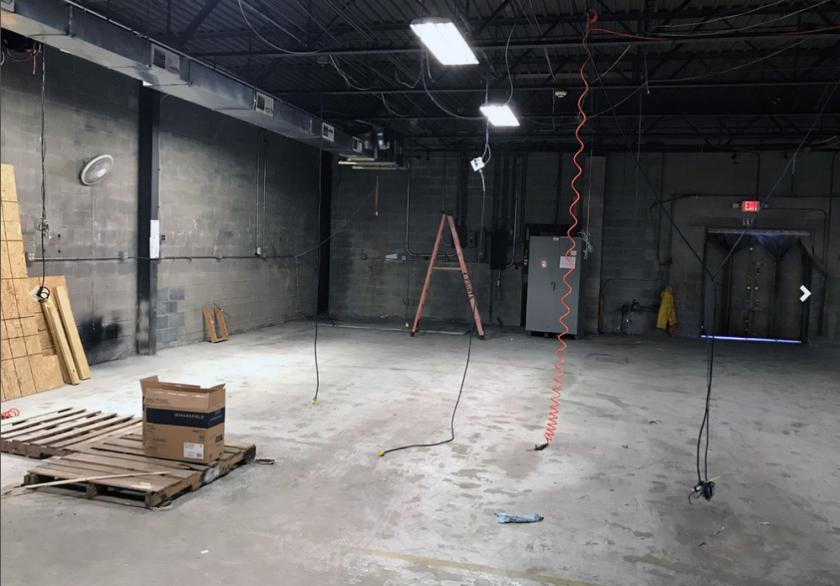
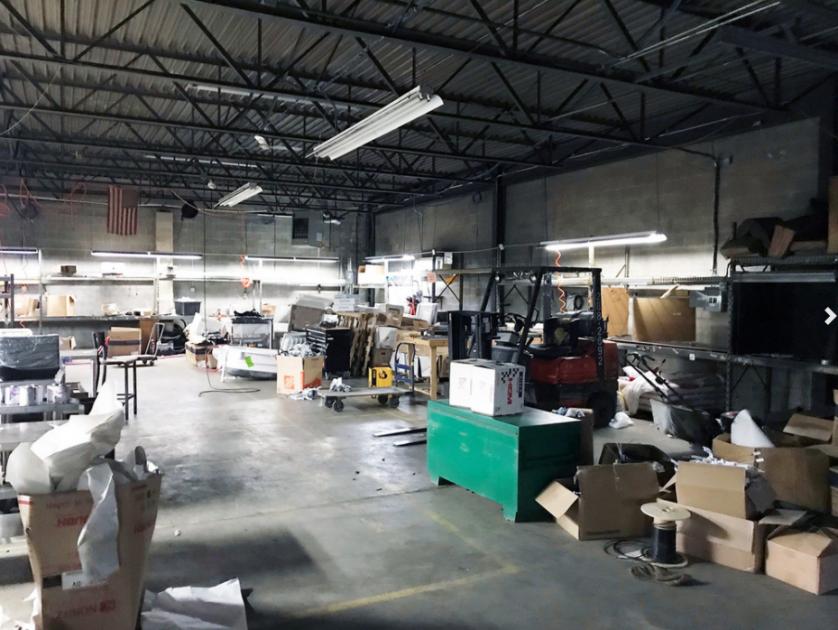
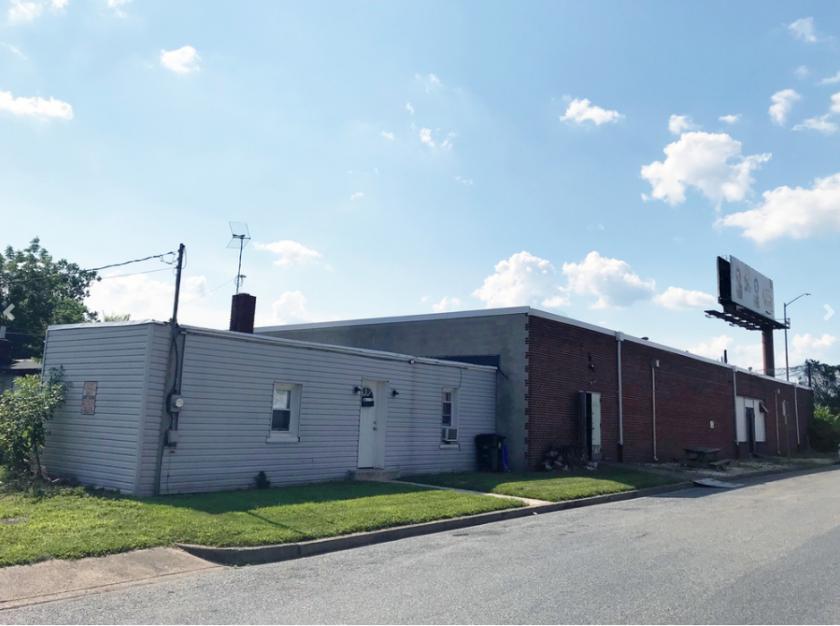
- • Warehouse for sale
- • Rooftop I-83 signage visible to 110,000 VPD
- • Real Estate Taxes $13,046
- • Rare large secure yard
Listing Agents

Chuck Heller
O: 717-731-1990
cheller@landmarkcr.com
O: 717-731-1990
cheller@landmarkcr.com

Roy Brenner
O: 717-731-1990
M: 717-512-3966
rbrenner@landmarkcr.com
O: 717-731-1990
M: 717-512-3966
rbrenner@landmarkcr.com
While we strive to provide the most accurate information, all listing information, and demographic data, is provided by third-parties. As such, MyEListing will not be responsible for the accuracy of the information. It is strongly recommended that you verify all information with the listing agent, and any relevant agencies, prior to making any decisions.