Industrial Properties
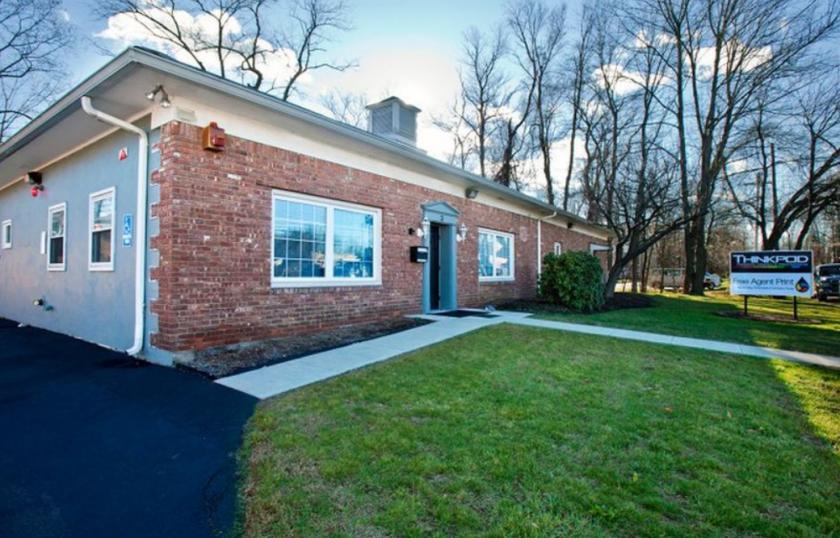
3 Industrial Road Pequannock Township, NJ 07440
3 Industrial Road Pequannock Township, NJ 07440
Details & Description
Property Highlights
- • Lot Size 0.36 Acres Block 4601, Lot 14
- • Year Built 1962 and Remodeled 2012
- • Construction Block and Wood Frame
- • Ceiling Height 9 Dropped Ceiling
- • Utilities Gas Heat, City Water Sewer
Listing Agents

Anthony Bufanio
O: 973-379-6644
M: 973-568-6612
ambufanio@blauberg.com
O: 973-379-6644
M: 973-568-6612
ambufanio@blauberg.com
While we strive to provide the most accurate information, all listing information, and demographic data, is provided by third-parties. As such, MyEListing will not be responsible for the accuracy of the information. It is strongly recommended that you verify all information with the listing agent, and any relevant agencies, prior to making any decisions.