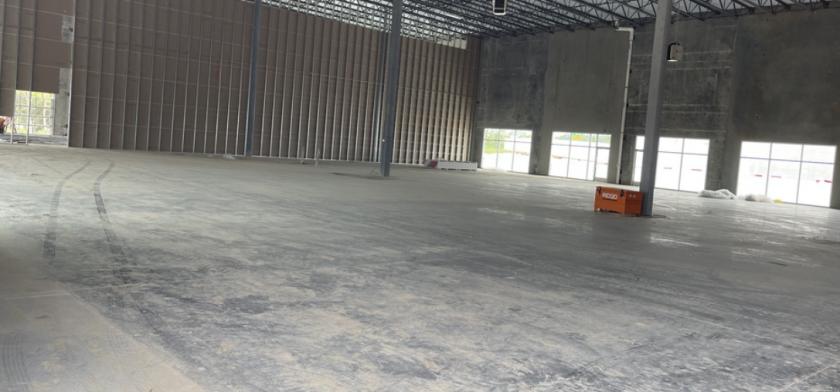
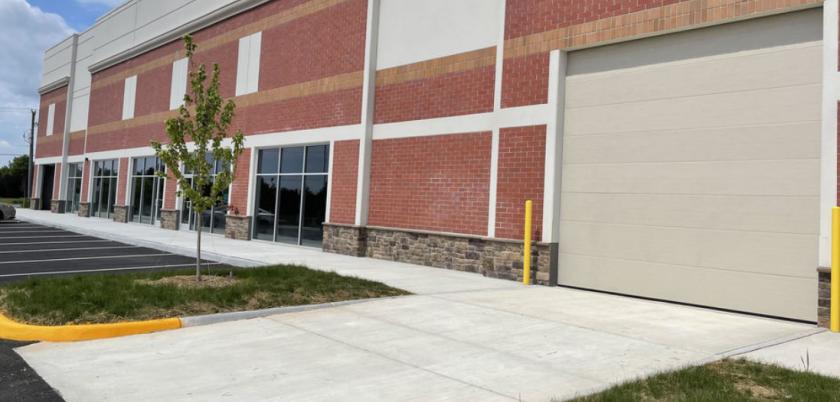
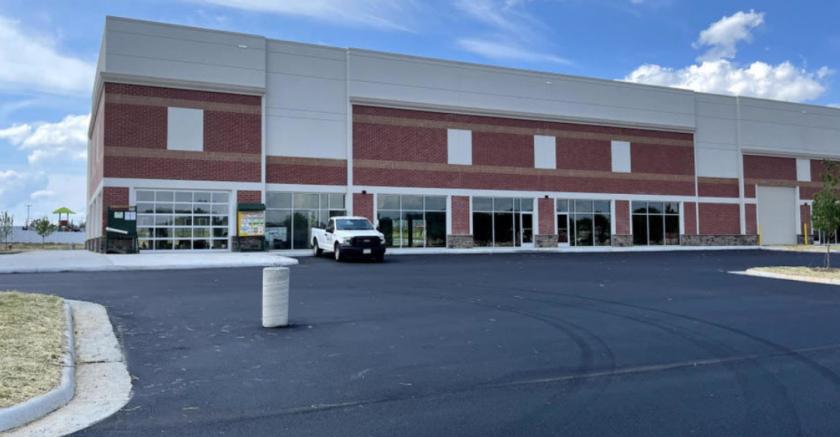
1-Mile | 3-Miles | 5-Miles | ||
---|---|---|---|---|
Total Population | 6,265 | 64,130 | 152,427 | |
Population Median Age | 36 | 38 | 36 | |
Population by Age | 0-9 Yrs | 784 (12%) | 8395 (13%) | 21264 (13%) |
10-19 Yrs | 610 (9%) | 9313 (14%) | 22917 (15%) | |
20-29 Yrs | 1035 (16%) | 7034 (10%) | 16453 (10%) | |
30-39 Yrs | 1302 (20%) | 9058 (14%) | 22857 (14%) | |
40-49 Yrs | 909 (14%) | 9825 (15%) | 25825 (16%) | |
50-59 Yrs | 774 (12%) | 8852 (13%) | 21382 (14%) | |
60-69 Yrs | 431 (6%) | 5126 (7%) | 11247 (7%) | |
70+ Yrs | 419 (6%) | 6527 (10%) | 10481 (6%) | |
Median HH Income | $108,490 | $127,819 | $136,619 | |
Total Household Income | < 24K | 173 (7%) | 1349 (5%) | 2684 (5%) |
25-49K | 221 (9%) | 2138 (9%) | 4372 (8%) | |
50-74K | 344 (15%) | 3035 (13%) | 5744 (11%) | |
75-99K | 304 (13%) | 2536 (10%) | 5368 (10%) | |
100-199K | 821 (36%) | 8042 (34%) | 19566 (37%) | |
200K+ | 403 (17%) | 6119 (26%) | 14435 (27%) | |
Highest Education Level | No Diploma | 194 | 1797 | 5536 |
Diploma or GED | 594 | 4775 | 11565 | |
Some College | 636 | 6669 | 14722 | |
Assoc. Degree | 364 | 3059 | 6309 | |
Bachelors Degree | 1362 | 15306 | 36280 | |
Higher Degree | 1215 | 11562 | 25498 | |
Total Housing Units | 2,421 | 24,209 | 54,057 | |
--Owner-Occupied | 1,139 | 16,616 | 37,831 | |
--Renter-Occupied | 1,127 | 6,603 | 14,339 | |
Owner-Occupied Values | < 100K | 20 | 332 | 622 |
100-199K | 26 | 559 | 990 | |
200-299K | 73 | 1449 | 3095 | |
300-399K | 359 | 3299 | 7320 | |
400-499K | 156 | 2909 | 7060 | |
500K+ | 506 | 8068 | 18744 | |
Total Working Age Population | 5,098 | 49,754 | 116,309 | |
In Work Force | 3,853 | 35,318 | 86,598 | |
Not In Work Force | 1,245 | 14,436 | 29,711 | |
Workforce Employed | 3,735 | 34,041 | 83,443 | |
Workforce Unemployed | 86 | 1,008 | 2,636 | |
Civlian Workforce | 3,820 | 35,049 | 86,078 | |
Military Workforce | 33 | 269 | 519 | |
Total Households | 2,267 | 23,219 | 52,170 | |
Family Households | 1,421 | 16,025 | 38,382 | |
Non-Family Households | 846 | 7,194 | 13,788 | |
Married Couple | 1,130 | 13,487 | 32,404 | |
Other Family | 290 | 2,539 | 5,978 | |
Married w/Child | 536 | 7,045 | 18,040 | |
Single Male w/Child | 25 | 368 | 873 | |
Single Female w/Child | 164 | 1,092 | 2,468 |
Population Change Last Two Decades - Plus Projection
2000 | % | 2010 | % | 2020 | % | 2030 | |
---|---|---|---|---|---|---|---|
Maryland | 5,296,486 | +9 | 5,773,552 | +6 | 6,141,900 | +6 | 6,518,750 |
Montgomery County | 873,341 | +11 | 971,777 | +8 | 1,052,050 | +7 | 1,128,800 |
Virginia | 7,078,515 | +13 | 8,001,024 | +8 | 8,655,021 | +8 | 9,331,666 |
Fairfax County | 969,749 | +12 | 1,081,726 | +7 | 1,162,504 | +7 | 1,244,025 |
Loudoun County | 169,599 | +84 | 312,311 | +38 | 430,584 | +29 | 554,808 |
Total Working Age Population:
Total Households:
Total Working Age Population:
Total Households:
Total Working Age Population:
Total Households: