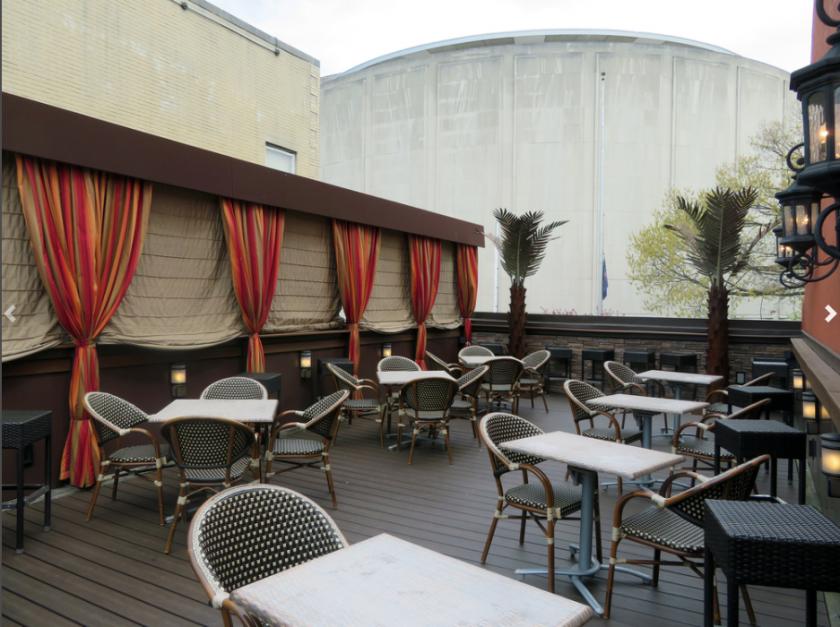
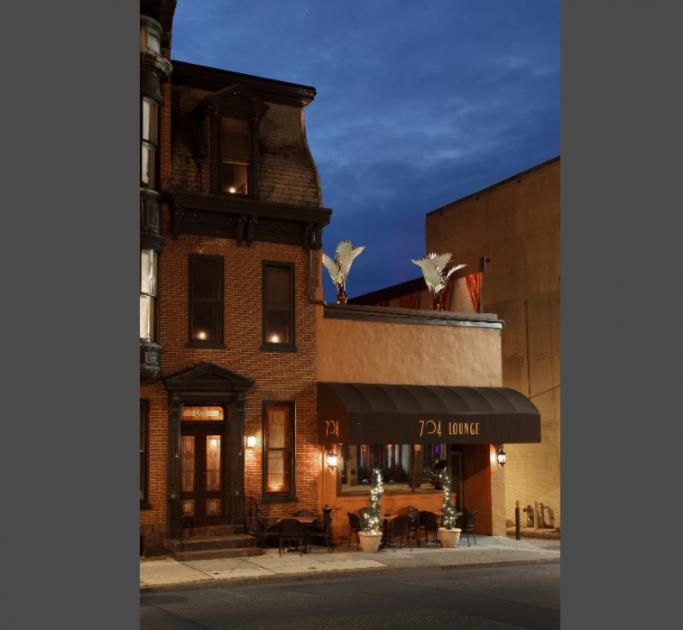
1-Mile | 3-Miles | 5-Miles | ||
---|---|---|---|---|
Total Population | 21,154 | 118,419 | 218,930 | |
Population Median Age | 38 | 38 | 39 | |
Population by Age | 0-9 Yrs | 2055 (9%) | 14867 (12%) | 25965 (11%) |
10-19 Yrs | 1411 (6%) | 12763 (10%) | 24490 (11%) | |
20-29 Yrs | 4806 (22%) | 20943 (17%) | 34129 (15%) | |
30-39 Yrs | 3446 (16%) | 16679 (14%) | 30413 (13%) | |
40-49 Yrs | 3013 (14%) | 15050 (12%) | 28668 (13%) | |
50-59 Yrs | 2641 (12%) | 15543 (13%) | 29334 (13%) | |
60-69 Yrs | 2062 (9%) | 12521 (10%) | 24582 (11%) | |
70+ Yrs | 1722 (8%) | 10053 (8%) | 21349 (9%) | |
Median HH Income | $45,008 | $52,387 | $57,053 | |
Total Household Income | < 24K | 3304 (28%) | 11482 (21%) | 17617 (18%) |
25-49K | 2883 (24%) | 13731 (25%) | 22942 (24%) | |
50-74K | 2374 (20%) | 10728 (20%) | 18222 (19%) | |
75-99K | 1416 (12%) | 6983 (13%) | 13251 (14%) | |
100-199K | 1383 (11%) | 8401 (15%) | 17788 (19%) | |
200K+ | 291 (2%) | 1707 (3%) | 3691 (3%) | |
Highest Education Level | No Diploma | 2020 | 10614 | 16451 |
Diploma or GED | 4063 | 24284 | 47465 | |
Some College | 2764 | 14513 | 26107 | |
Assoc. Degree | 728 | 6432 | 12725 | |
Bachelors Degree | 3618 | 16706 | 32276 | |
Higher Degree | 2452 | 9719 | 18753 | |
Total Housing Units | 14,898 | 61,572 | 104,980 | |
--Owner-Occupied | 3,373 | 24,018 | 49,746 | |
--Renter-Occupied | 8,278 | 29,015 | 43,765 | |
Owner-Occupied Values | < 100K | 626 | 6188 | 8795 |
100-199K | 2292 | 12599 | 25241 | |
200-299K | 432 | 3821 | 10424 | |
300-399K | 1 | 749 | 3046 | |
400-499K | 12 | 276 | 1196 | |
500K+ | 10 | 385 | 1044 | |
Total Working Age Population | 18,347 | 95,782 | 177,895 | |
In Work Force | 13,261 | 65,749 | 117,434 | |
Not In Work Force | 5,086 | 30,033 | 60,461 | |
Workforce Employed | 12,568 | 62,122 | 111,489 | |
Workforce Unemployed | 692 | 3,589 | 5,771 | |
Civlian Workforce | 13,261 | 65,711 | 117,260 | |
Military Workforce | 0 | 38 | 174 | |
Total Households | 11,651 | 53,033 | 93,511 | |
Family Households | 3,418 | 26,437 | 51,002 | |
Non-Family Households | 8,233 | 26,595 | 42,508 | |
Married Couple | 1,767 | 15,735 | 33,784 | |
Other Family | 1,651 | 10,703 | 17,218 | |
Married w/Child | 434 | 5,368 | 12,083 | |
Single Male w/Child | 213 | 1,442 | 2,245 | |
Single Female w/Child | 692 | 4,607 | 7,196 |
Population Change Last Two Decades - Plus Projection
2000 | % | 2010 | % | 2020 | % | 2030 | |
---|---|---|---|---|---|---|---|
Pennsylvania | 12,281,054 | +3 | 12,702,379 | +4 | 13,230,170 | +4 | 13,759,594 |
Cumberland County | 213,674 | +10 | 235,406 | +7 | 251,836 | +6 | 268,063 |
Dauphin County | 251,798 | +6 | 268,100 | +4 | 279,506 | +3 | 289,132 |
Juniata County | 22,821 | +8 | 24,636 | 0 | 24,681 | +1 | 25,013 |
Perry County | 43,602 | +5 | 45,969 | +6 | 48,597 | +4 | 50,348 |
York County | 381,751 | +14 | 434,972 | +6 | 460,514 | +5 | 484,497 |
Total Working Age Population:
Total Households:
Total Working Age Population:
Total Households:
Total Working Age Population:
Total Households: