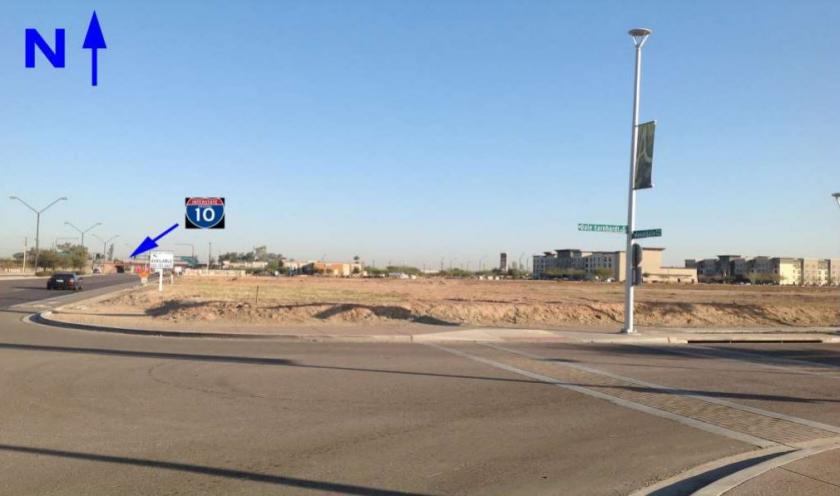
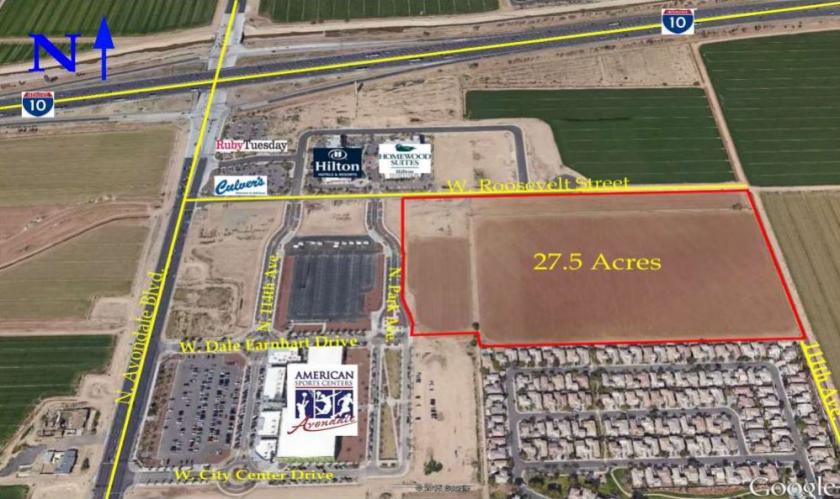
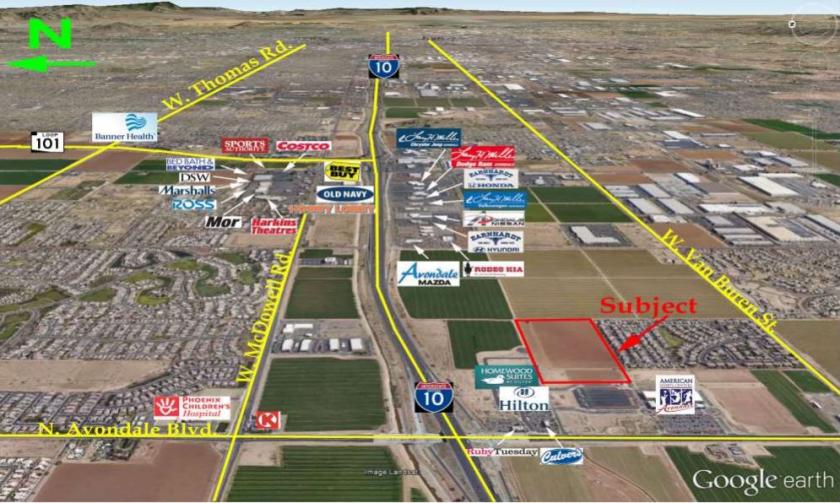
1-Mile | 3-Miles | 5-Miles | ||
---|---|---|---|---|
Total Population | 7,981 | 97,330 | 245,953 | |
Population Median Age | 32 | 33 | 32 | |
Population by Age | 0-9 Yrs | 1323 (16%) | 15342 (15%) | 40451 (16%) |
10-19 Yrs | 1134 (14%) | 15684 (16%) | 40895 (16%) | |
20-29 Yrs | 1537 (19%) | 16812 (17%) | 42052 (17%) | |
30-39 Yrs | 1344 (16%) | 14096 (14%) | 35050 (14%) | |
40-49 Yrs | 980 (12%) | 12539 (12%) | 32396 (13%) | |
50-59 Yrs | 850 (10%) | 10862 (11%) | 26019 (10%) | |
60-69 Yrs | 536 (6%) | 7458 (7%) | 17471 (7%) | |
70+ Yrs | 277 (3%) | 4538 (4%) | 11619 (4%) | |
Median HH Income | $61,771 | $65,422 | $63,014 | |
Total Household Income | < 24K | 277 (10%) | 3687 (12%) | 9796 (13%) |
25-49K | 655 (25%) | 6660 (22%) | 16549 (23%) | |
50-74K | 615 (24%) | 6463 (22%) | 16014 (22%) | |
75-99K | 439 (17%) | 5011 (17%) | 11350 (16%) | |
100-199K | 463 (18%) | 6450 (22%) | 14850 (20%) | |
200K+ | 94 (3%) | 945 (3%) | 2342 (3%) | |
Highest Education Level | No Diploma | 632 | 10505 | 29241 |
Diploma or GED | 1108 | 16573 | 40525 | |
Some College | 1433 | 15704 | 35858 | |
Assoc. Degree | 529 | 5768 | 13416 | |
Bachelors Degree | 724 | 6863 | 17194 | |
Higher Degree | 367 | 3598 | 8756 | |
Total Housing Units | 2,648 | 31,147 | 75,699 | |
--Owner-Occupied | 1,290 | 16,795 | 41,179 | |
--Renter-Occupied | 1,254 | 12,422 | 29,722 | |
Owner-Occupied Values | < 100K | 33 | 1101 | 3266 |
100-199K | 422 | 5938 | 16641 | |
200-299K | 665 | 7975 | 15172 | |
300-399K | 158 | 1583 | 3986 | |
400-499K | 6 | 120 | 1128 | |
500K+ | 6 | 77 | 985 | |
Total Working Age Population | 5,961 | 72,054 | 180,259 | |
In Work Force | 4,317 | 50,569 | 125,156 | |
Not In Work Force | 1,644 | 21,485 | 55,104 | |
Workforce Employed | 4,127 | 47,494 | 117,235 | |
Workforce Unemployed | 174 | 2,820 | 7,184 | |
Civlian Workforce | 4,301 | 50,314 | 124,419 | |
Military Workforce | 16 | 255 | 737 | |
Total Households | 2,544 | 29,217 | 70,901 | |
Family Households | 1,765 | 22,674 | 55,367 | |
Non-Family Households | 779 | 6,543 | 15,533 | |
Married Couple | 1,090 | 14,908 | 36,242 | |
Other Family | 675 | 7,767 | 19,125 | |
Married w/Child | 649 | 7,888 | 19,431 | |
Single Male w/Child | 122 | 1,384 | 2,973 | |
Single Female w/Child | 239 | 2,953 | 7,925 |
Population Change Last Two Decades - Plus Projection
2000 | % | 2010 | % | 2020 | % | 2030 | |
---|---|---|---|---|---|---|---|
Arizona | 5,130,632 | +25 | 6,392,017 | +14 | 7,286,100 | +14 | 8,284,900 |
Maricopa County | 3,072,149 | +24 | 3,817,117 | +16 | 4,436,900 | +15 | 5,107,700 |
Total Working Age Population:
Total Households:
Total Working Age Population:
Total Households:
Total Working Age Population:
Total Households: