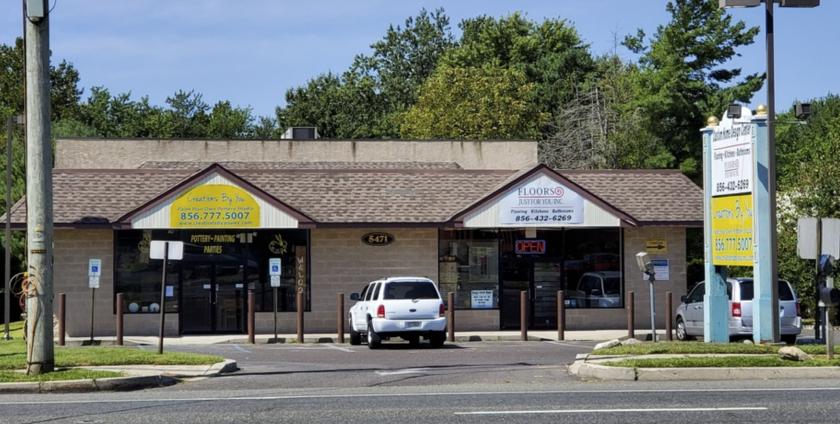
1-Mile | 3-Miles | 5-Miles | ||
---|---|---|---|---|
Total Population | 7,853 | 66,679 | 173,744 | |
Population Median Age | 41 | 39 | 39 | |
Population by Age | 0-9 Yrs | 787 (10%) | 7550 (11%) | 19959 (11%) |
10-19 Yrs | 961 (12%) | 8655 (12%) | 22496 (12%) | |
20-29 Yrs | 950 (12%) | 9173 (13%) | 24389 (14%) | |
30-39 Yrs | 995 (12%) | 8054 (12%) | 21101 (12%) | |
40-49 Yrs | 1035 (13%) | 8850 (13%) | 23036 (13%) | |
50-59 Yrs | 1144 (14%) | 9928 (14%) | 25611 (14%) | |
60-69 Yrs | 1102 (14%) | 8659 (12%) | 21280 (12%) | |
70+ Yrs | 878 (11%) | 5810 (8%) | 15872 (9%) | |
Median HH Income | $96,962 | $93,756 | $80,139 | |
Total Household Income | < 24K | 129 (4%) | 1942 (8%) | 7936 (12%) |
25-49K | 393 (14%) | 3529 (15%) | 11263 (17%) | |
50-74K | 483 (17%) | 3695 (15%) | 10731 (16%) | |
75-99K | 388 (14%) | 3240 (13%) | 9079 (14%) | |
100-199K | 1069 (39%) | 8505 (36%) | 19298 (30%) | |
200K+ | 230 (8%) | 2283 (9%) | 5287 (8%) | |
Highest Education Level | No Diploma | 206 | 2529 | 8418 |
Diploma or GED | 1902 | 14454 | 37660 | |
Some College | 1053 | 9513 | 25075 | |
Assoc. Degree | 441 | 4158 | 10858 | |
Bachelors Degree | 1381 | 10561 | 25389 | |
Higher Degree | 620 | 4828 | 11685 | |
Total Housing Units | 2,988 | 24,619 | 68,186 | |
--Owner-Occupied | 2,343 | 18,535 | 47,704 | |
--Renter-Occupied | 349 | 4,659 | 15,888 | |
Owner-Occupied Values | < 100K | 75 | 763 | 4169 |
100-199K | 880 | 6146 | 19136 | |
200-299K | 1185 | 8300 | 17285 | |
300-399K | 138 | 2381 | 5135 | |
400-499K | 46 | 589 | 1197 | |
500K+ | 18 | 356 | 783 | |
Total Working Age Population | 6,409 | 53,691 | 140,013 | |
In Work Force | 4,314 | 37,378 | 96,118 | |
Not In Work Force | 2,096 | 16,313 | 43,896 | |
Workforce Employed | 4,083 | 35,197 | 90,303 | |
Workforce Unemployed | 231 | 2,170 | 5,784 | |
Civlian Workforce | 4,314 | 37,367 | 96,087 | |
Military Workforce | 0 | 11 | 31 | |
Total Households | 2,692 | 23,194 | 63,593 | |
Family Households | 2,076 | 17,373 | 43,889 | |
Non-Family Households | 616 | 5,821 | 19,703 | |
Married Couple | 1,688 | 13,161 | 31,731 | |
Other Family | 388 | 4,212 | 12,158 | |
Married w/Child | 692 | 5,122 | 12,327 | |
Single Male w/Child | 17 | 552 | 1,391 | |
Single Female w/Child | 112 | 1,385 | 4,656 |
Population Change Last Two Decades - Plus Projection
2000 | % | 2010 | % | 2020 | % | 2030 | |
---|---|---|---|---|---|---|---|
New Jersey | 8,414,350 | +4 | 8,791,894 | +4 | 9,132,700 | +4 | 9,530,900 |
Atlantic County | 252,552 | +9 | 274,549 | +1 | 276,200 | +2 | 280,600 |
Burlington County | 423,394 | +6 | 448,734 | 0 | 450,000 | +3 | 464,900 |
Camden County | 508,932 | +1 | 513,657 | 0 | 511,800 | +2 | 521,000 |
Gloucester County | 254,673 | +13 | 288,288 | +1 | 292,000 | +5 | 305,800 |
Salem County | 64,285 | +3 | 66,083 | -5 | 63,000 | -3 | 61,000 |
Total Working Age Population:
Total Households:
Total Working Age Population:
Total Households:
Total Working Age Population:
Total Households: