Commercial Land
Egg Harbor Rd Blackwood Barnsboro Rd Washington Township, NJ 08080
Egg Harbor Rd Blackwood Barnsboro Rd Washington Township, NJ 08080

Details & Description
Property Highlights
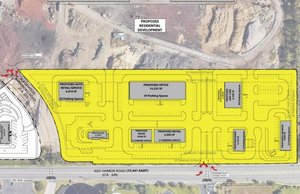
• Highly visible for retail, restaurant or medicaloffice users
• Be part of the newest growth area in Washington Township
Listing Agents

Tammy Rattacasa
O: 856-392-3735
tammyr@arrowcre.com
O: 856-392-3735
tammyr@arrowcre.com
While we strive to provide the most accurate information, all listing information, and demographic data, is provided by third-parties. As such, MyEListing will not be responsible for the accuracy of the information. It is strongly recommended that you verify all information with the listing agent, and any relevant agencies, prior to making any decisions.