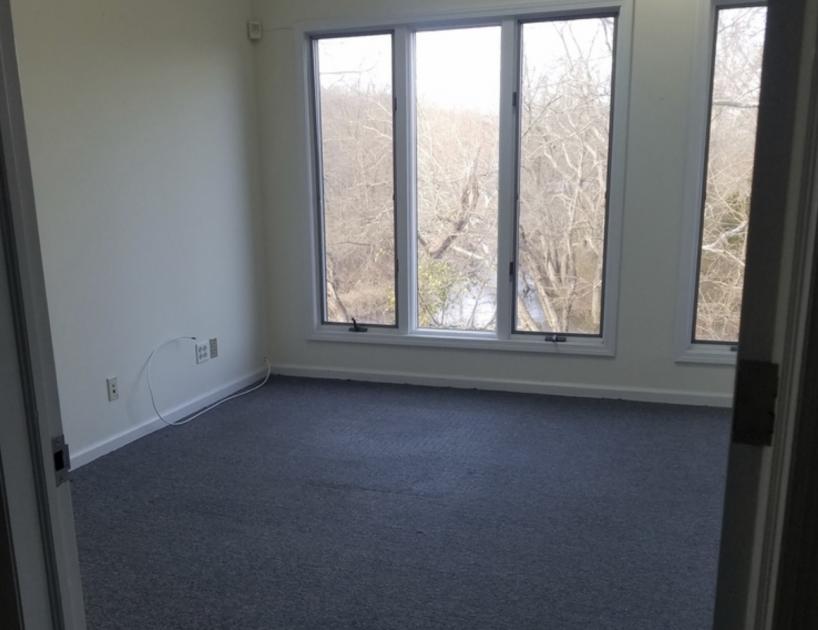
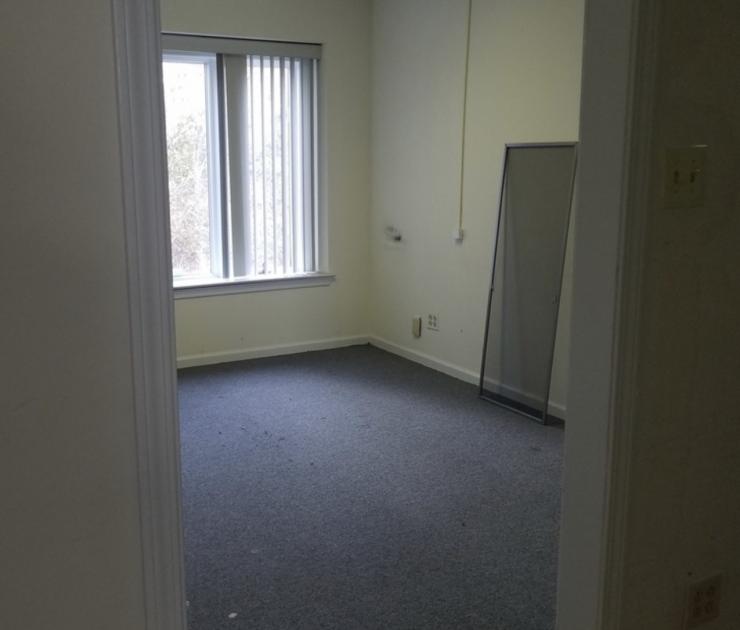
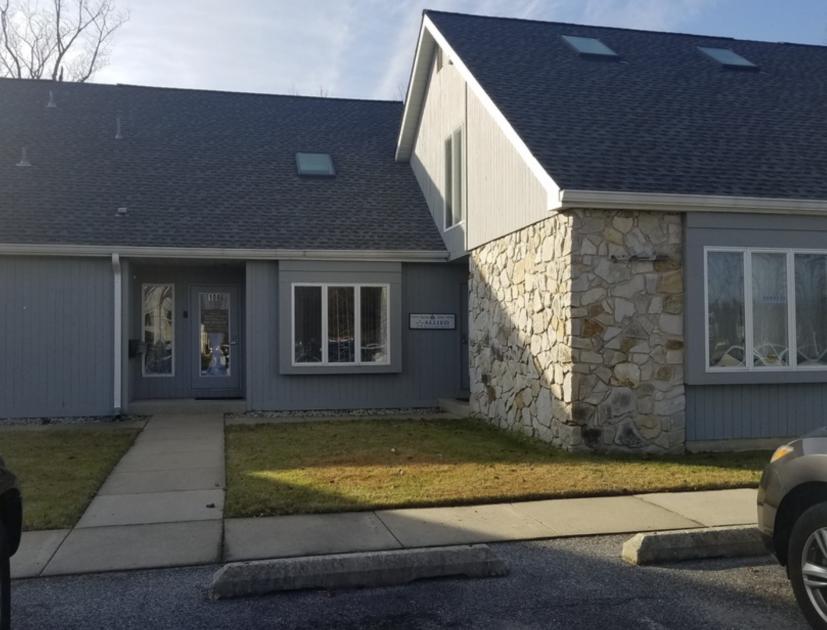
1-Mile | 3-Miles | 5-Miles | ||
---|---|---|---|---|
Total Population | 6,464 | 72,920 | 189,499 | |
Population Median Age | 37 | 39 | 39 | |
Population by Age | 0-9 Yrs | 928 (14%) | 8497 (11%) | 21812 (11%) |
10-19 Yrs | 797 (12%) | 8793 (12%) | 23180 (12%) | |
20-29 Yrs | 994 (15%) | 10419 (14%) | 26161 (13%) | |
30-39 Yrs | 856 (13%) | 8968 (12%) | 23563 (12%) | |
40-49 Yrs | 810 (12%) | 9438 (12%) | 25071 (13%) | |
50-59 Yrs | 791 (12%) | 10397 (14%) | 28378 (14%) | |
60-69 Yrs | 799 (12%) | 9317 (12%) | 23339 (12%) | |
70+ Yrs | 490 (7%) | 7091 (9%) | 17996 (9%) | |
Median HH Income | $75,063 | $76,453 | $78,810 | |
Total Household Income | < 24K | 329 (14%) | 3344 (12%) | 8987 (12%) |
25-49K | 583 (24%) | 5518 (20%) | 12620 (17%) | |
50-74K | 258 (11%) | 4639 (16%) | 12157 (17%) | |
75-99K | 314 (13%) | 3763 (13%) | 10028 (14%) | |
100-199K | 675 (28%) | 7942 (28%) | 21210 (30%) | |
200K+ | 183 (7%) | 2233 (8%) | 5585 (7%) | |
Highest Education Level | No Diploma | 291 | 3621 | 9281 |
Diploma or GED | 1124 | 15906 | 43416 | |
Some College | 833 | 10609 | 27718 | |
Assoc. Degree | 480 | 4646 | 11740 | |
Bachelors Degree | 1023 | 10922 | 27720 | |
Higher Degree | 422 | 5026 | 12267 | |
Total Housing Units | 2,461 | 29,413 | 75,512 | |
--Owner-Occupied | 1,333 | 19,075 | 51,705 | |
--Renter-Occupied | 1,009 | 8,363 | 18,881 | |
Owner-Occupied Values | < 100K | 49 | 1397 | 3994 |
100-199K | 227 | 7125 | 21605 | |
200-299K | 697 | 7720 | 19009 | |
300-399K | 301 | 2090 | 5041 | |
400-499K | 22 | 343 | 1205 | |
500K+ | 37 | 399 | 851 | |
Total Working Age Population | 5,046 | 58,759 | 153,007 | |
In Work Force | 3,579 | 40,315 | 106,054 | |
Not In Work Force | 1,467 | 18,444 | 46,953 | |
Workforce Employed | 3,377 | 37,906 | 99,601 | |
Workforce Unemployed | 196 | 2,398 | 6,414 | |
Civlian Workforce | 3,573 | 40,304 | 106,015 | |
Military Workforce | 6 | 11 | 39 | |
Total Households | 2,342 | 27,438 | 70,587 | |
Family Households | 1,568 | 18,705 | 48,648 | |
Non-Family Households | 774 | 8,733 | 21,939 | |
Married Couple | 1,125 | 13,451 | 34,976 | |
Other Family | 443 | 5,254 | 13,672 | |
Married w/Child | 502 | 5,143 | 13,519 | |
Single Male w/Child | 125 | 526 | 1,597 | |
Single Female w/Child | 211 | 2,074 | 4,943 |
Population Change Last Two Decades - Plus Projection
2000 | % | 2010 | % | 2020 | % | 2030 | |
---|---|---|---|---|---|---|---|
New Jersey | 8,414,350 | +4 | 8,791,894 | +4 | 9,132,700 | +4 | 9,530,900 |
Atlantic County | 252,552 | +9 | 274,549 | +1 | 276,200 | +2 | 280,600 |
Burlington County | 423,394 | +6 | 448,734 | 0 | 450,000 | +3 | 464,900 |
Camden County | 508,932 | +1 | 513,657 | 0 | 511,800 | +2 | 521,000 |
Gloucester County | 254,673 | +13 | 288,288 | +1 | 292,000 | +5 | 305,800 |
Salem County | 64,285 | +3 | 66,083 | -5 | 63,000 | -3 | 61,000 |
Total Working Age Population:
Total Households:
Total Working Age Population:
Total Households:
Total Working Age Population:
Total Households: