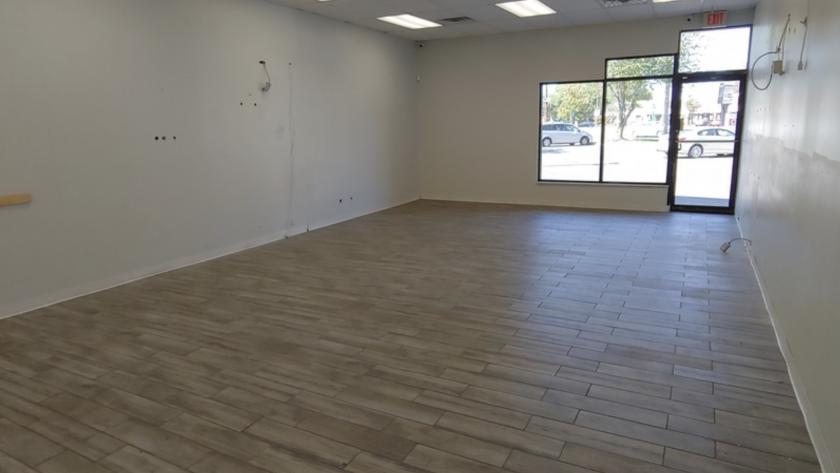
Retail Space
1973 North Olden Avenue Ewing Township, NJ 08618
1973 North Olden Avenue Ewing Township, NJ 08618
Details & Description
Property Highlights
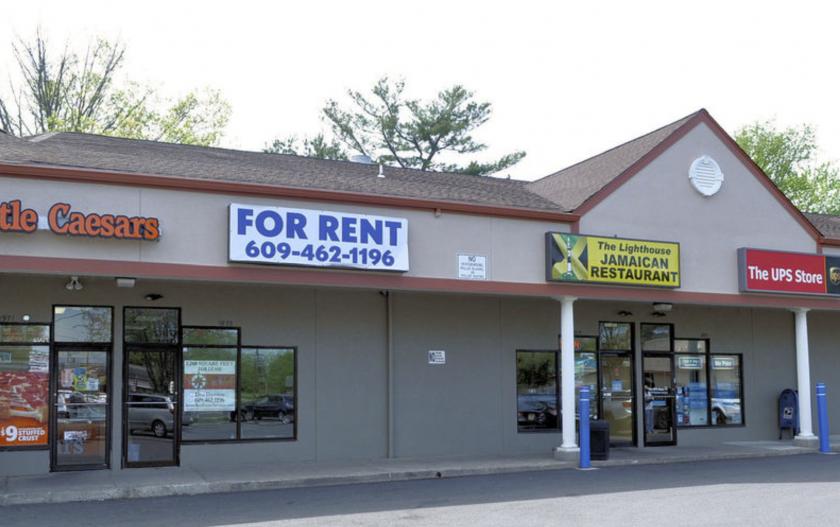
• Situated between Little Caesars The Lighthouse Jamaican Restaurants
• Ideal for Local Retail, Medical, Services, or General Business
Listing Agents

Dru Damico
O: 609-462-1196
dru@arrowcre.com
O: 609-462-1196
dru@arrowcre.com
While we strive to provide the most accurate information, all listing information, and demographic data, is provided by third-parties. As such, MyEListing will not be responsible for the accuracy of the information. It is strongly recommended that you verify all information with the listing agent, and any relevant agencies, prior to making any decisions.