Office Space
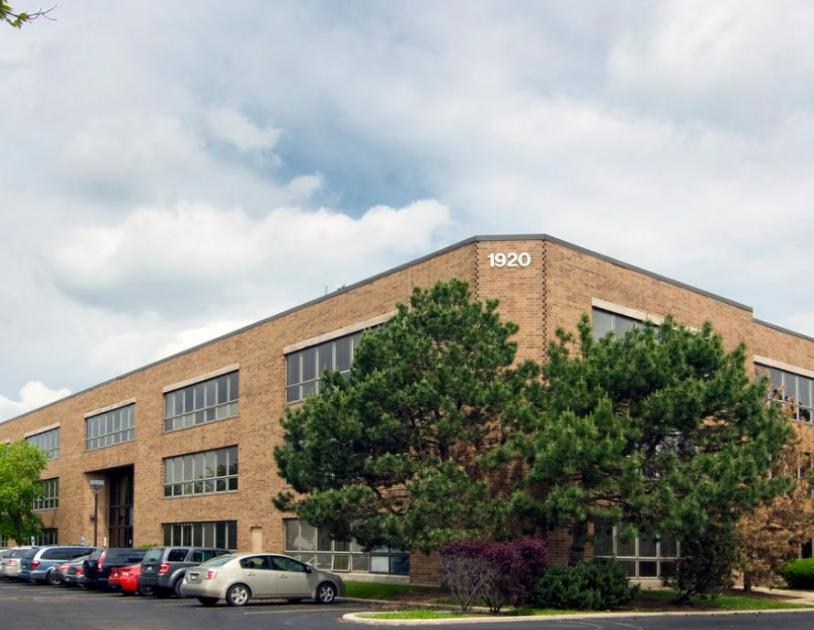
1920 South Highland Avenue Lombard, IL 60148
1920 South Highland Avenue Lombard, IL 60148
Details & Description
Property Highlights
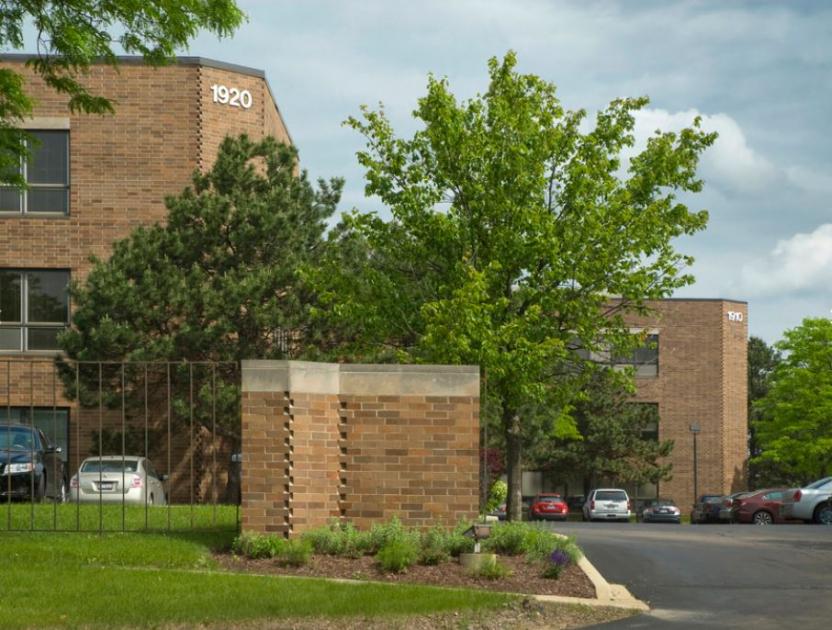
• 51,000 parking ratio to accommodate heaving parking requirement
• Building signage available by code
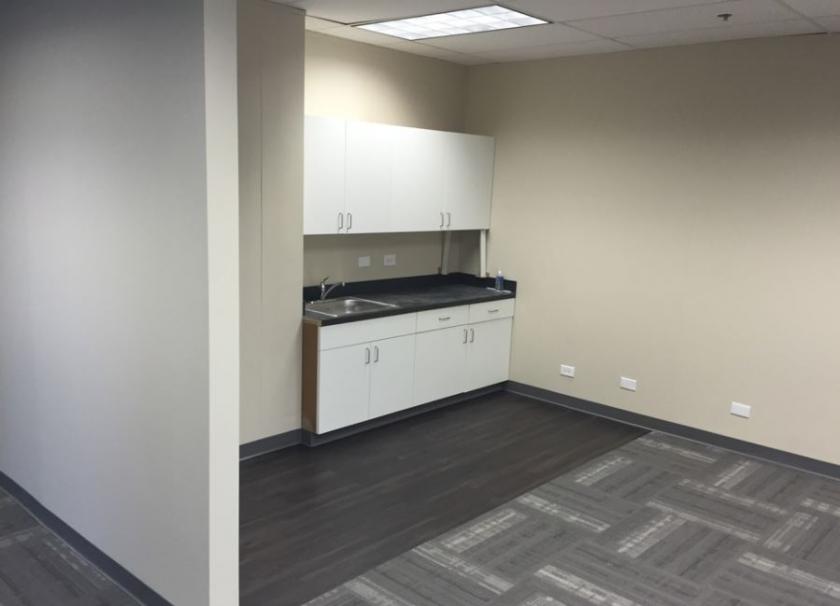
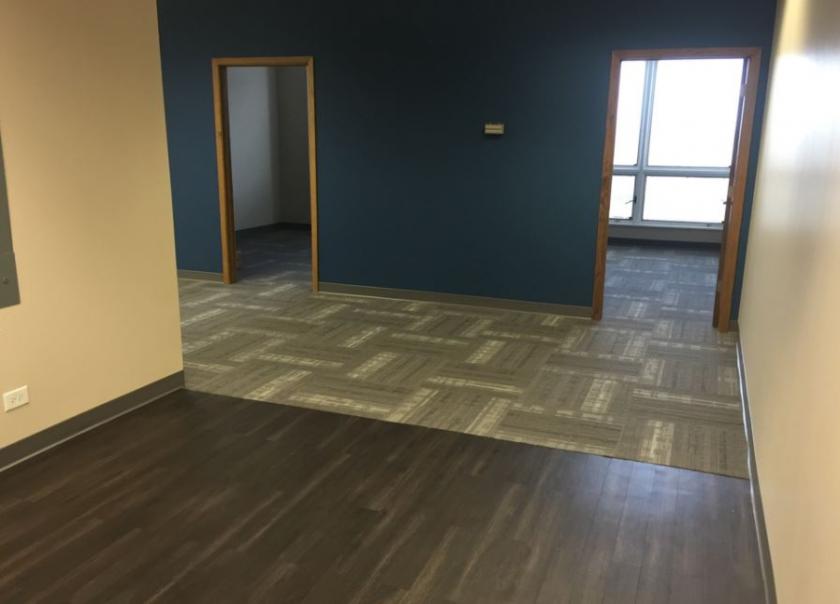
Additional Photos
Listing Agents

Joel Berger
O: 630-225-2600
M: 312-231-2267
jberger@bradfordallen.com
O: 630-225-2600
M: 312-231-2267
jberger@bradfordallen.com
While we strive to provide the most accurate information, all listing information, and demographic data, is provided by third-parties. As such, MyEListing will not be responsible for the accuracy of the information. It is strongly recommended that you verify all information with the listing agent, and any relevant agencies, prior to making any decisions.


