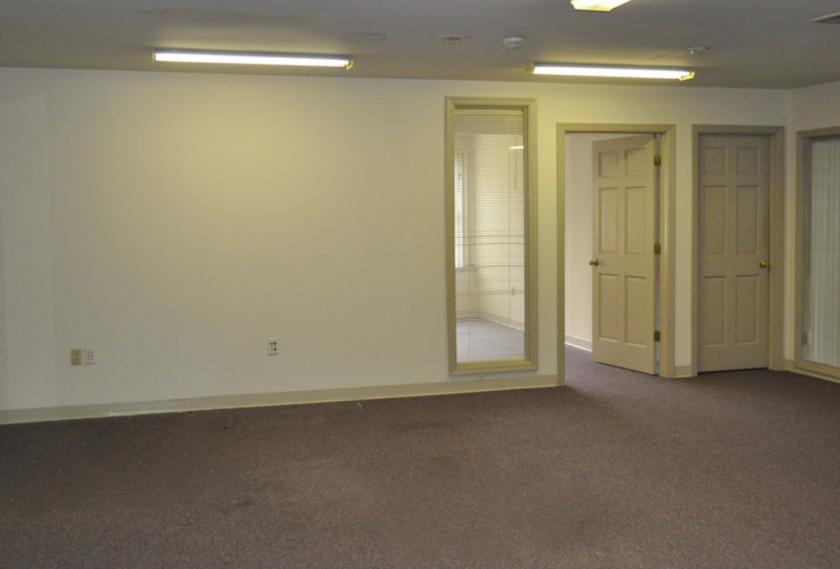
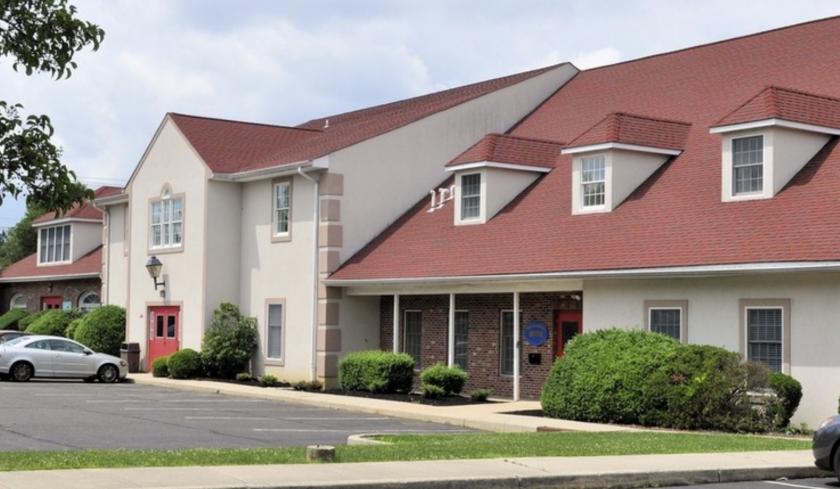
1-Mile | 3-Miles | 5-Miles | ||
---|---|---|---|---|
Total Population | 7,408 | 33,881 | 113,868 | |
Population Median Age | 42 | 39 | 38 | |
Population by Age | 0-9 Yrs | 614 (8%) | 3625 (10%) | 14492 (12%) |
10-19 Yrs | 693 (9%) | 3448 (10%) | 13231 (11%) | |
20-29 Yrs | 1182 (15%) | 6024 (17%) | 16690 (14%) | |
30-39 Yrs | 1015 (13%) | 4169 (12%) | 16534 (14%) | |
40-49 Yrs | 785 (10%) | 4201 (12%) | 14738 (12%) | |
50-59 Yrs | 1261 (17%) | 5141 (15%) | 15407 (13%) | |
60-69 Yrs | 1006 (13%) | 4200 (12%) | 12676 (11%) | |
70+ Yrs | 854 (11%) | 3074 (9%) | 10099 (8%) | |
Median HH Income | $85,952 | $89,695 | $72,011 | |
Total Household Income | < 24K | 336 (10%) | 1182 (9%) | 6205 (15%) |
25-49K | 434 (13%) | 1789 (14%) | 7921 (19%) | |
50-74K | 540 (17%) | 1963 (16%) | 6748 (16%) | |
75-99K | 575 (18%) | 2031 (16%) | 6268 (15%) | |
100-199K | 963 (30%) | 3875 (31%) | 9712 (24%) | |
200K+ | 276 (8%) | 1416 (11%) | 3230 (8%) | |
Highest Education Level | No Diploma | 340 | 1660 | 11611 |
Diploma or GED | 1649 | 7030 | 24462 | |
Some College | 1266 | 4961 | 15858 | |
Assoc. Degree | 375 | 2051 | 5359 | |
Bachelors Degree | 1227 | 5537 | 14136 | |
Higher Degree | 730 | 2679 | 6701 | |
Total Housing Units | 3,526 | 13,322 | 43,922 | |
--Owner-Occupied | 2,118 | 9,029 | 25,780 | |
--Renter-Occupied | 1,006 | 3,227 | 14,305 | |
Owner-Occupied Values | < 100K | 63 | 277 | 3084 |
100-199K | 568 | 2053 | 7310 | |
200-299K | 945 | 3505 | 7573 | |
300-399K | 323 | 1774 | 4199 | |
400-499K | 171 | 954 | 2212 | |
500K+ | 47 | 466 | 1401 | |
Total Working Age Population | 6,452 | 28,370 | 91,479 | |
In Work Force | 4,212 | 18,051 | 59,543 | |
Not In Work Force | 2,239 | 10,318 | 31,937 | |
Workforce Employed | 3,958 | 17,065 | 55,801 | |
Workforce Unemployed | 195 | 891 | 3,590 | |
Civlian Workforce | 4,153 | 17,955 | 59,390 | |
Military Workforce | 60 | 96 | 153 | |
Total Households | 3,124 | 12,256 | 40,084 | |
Family Households | 1,841 | 8,395 | 27,005 | |
Non-Family Households | 1,283 | 3,861 | 13,080 | |
Married Couple | 1,285 | 6,081 | 18,557 | |
Other Family | 556 | 2,314 | 8,447 | |
Married w/Child | 438 | 2,326 | 7,581 | |
Single Male w/Child | 0 | 89 | 715 | |
Single Female w/Child | 168 | 726 | 3,017 |
Population Change Last Two Decades - Plus Projection
2000 | % | 2010 | % | 2020 | % | 2030 | |
---|---|---|---|---|---|---|---|
New Jersey | 8,414,350 | +4 | 8,791,894 | +4 | 9,132,700 | +4 | 9,530,900 |
Burlington County | 423,394 | +6 | 448,734 | 0 | 450,000 | +3 | 464,900 |
Mercer County | 350,761 | +4 | 366,513 | +3 | 379,000 | +5 | 397,400 |
Monmouth County | 615,301 | +2 | 630,380 | 0 | 633,400 | +3 | 655,300 |
Pennsylvania | 12,281,054 | +3 | 12,702,379 | +4 | 13,230,170 | +4 | 13,759,594 |
Bucks County | 597,635 | +5 | 625,249 | +1 | 629,420 | +1 | 637,730 |
Total Working Age Population:
Total Households:
Total Working Age Population:
Total Households:
Total Working Age Population:
Total Households: