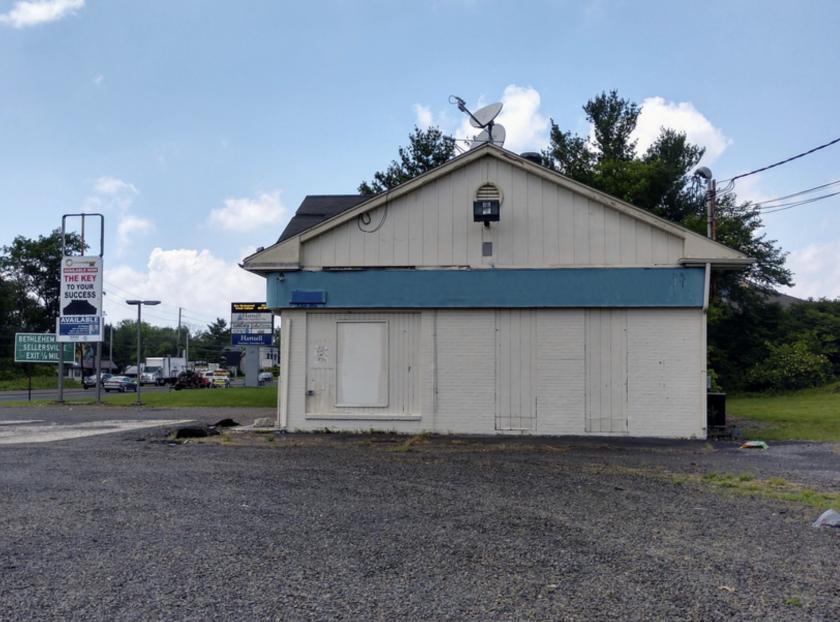
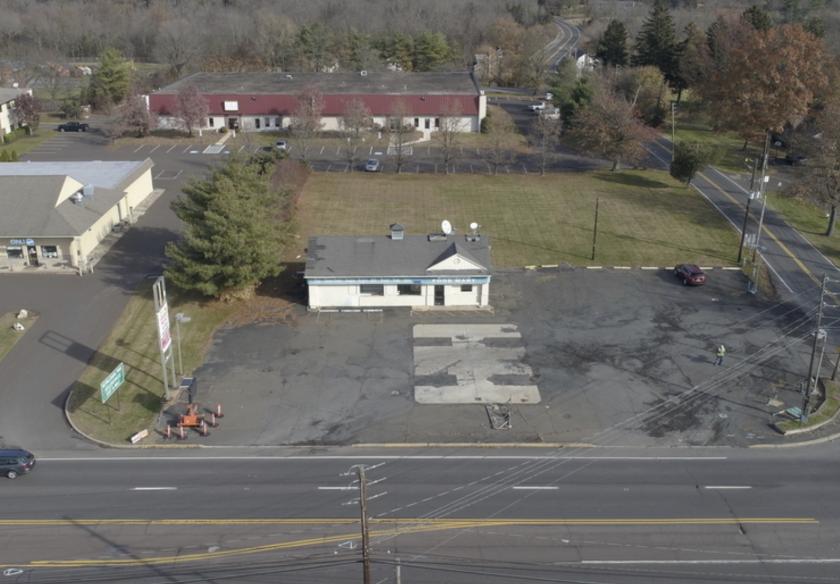
1-Mile | 3-Miles | 5-Miles | ||
---|---|---|---|---|
Total Population | 2,535 | 41,502 | 129,867 | |
Population Median Age | 41 | 40 | 41 | |
Population by Age | 0-9 Yrs | 225 (8%) | 4482 (10%) | 14171 (10%) |
10-19 Yrs | 354 (13%) | 5648 (13%) | 16422 (12%) | |
20-29 Yrs | 287 (11%) | 4609 (11%) | 14665 (11%) | |
30-39 Yrs | 324 (12%) | 5557 (13%) | 16609 (12%) | |
40-49 Yrs | 401 (15%) | 5277 (12%) | 16998 (13%) | |
50-59 Yrs | 354 (13%) | 5914 (14%) | 19257 (14%) | |
60-69 Yrs | 291 (11%) | 5183 (12%) | 15670 (12%) | |
70+ Yrs | 301 (11%) | 4831 (11%) | 16075 (12%) | |
Median HH Income | $78,359 | $77,699 | $83,972 | |
Total Household Income | < 24K | 154 (15%) | 2283 (14%) | 5638 (11%) |
25-49K | 150 (15%) | 2746 (17%) | 8326 (16%) | |
50-74K | 167 (17%) | 2709 (16%) | 8396 (16%) | |
75-99K | 145 (14%) | 2427 (15%) | 7290 (14%) | |
100-199K | 290 (29%) | 4494 (28%) | 14797 (29%) | |
200K+ | 75 (7%) | 1342 (8%) | 5506 (11%) | |
Highest Education Level | No Diploma | 140 | 2889 | 6587 |
Diploma or GED | 610 | 9182 | 26021 | |
Some College | 250 | 4354 | 14402 | |
Assoc. Degree | 124 | 2378 | 7272 | |
Bachelors Degree | 444 | 6881 | 24130 | |
Higher Degree | 225 | 3605 | 14045 | |
Total Housing Units | 1,020 | 16,706 | 52,043 | |
--Owner-Occupied | 730 | 11,348 | 35,772 | |
--Renter-Occupied | 250 | 4,653 | 14,180 | |
Owner-Occupied Values | < 100K | 106 | 648 | 1452 |
100-199K | 87 | 1504 | 4962 | |
200-299K | 190 | 4263 | 11761 | |
300-399K | 137 | 2806 | 9575 | |
400-499K | 74 | 1224 | 5057 | |
500K+ | 136 | 902 | 2965 | |
Total Working Age Population | 2,077 | 33,575 | 105,747 | |
In Work Force | 1,361 | 22,743 | 73,085 | |
Not In Work Force | 716 | 10,833 | 32,662 | |
Workforce Employed | 1,324 | 22,057 | 70,420 | |
Workforce Unemployed | 37 | 685 | 2,626 | |
Civlian Workforce | 1,361 | 22,742 | 73,047 | |
Military Workforce | 0 | 1 | 39 | |
Total Households | 981 | 16,000 | 49,952 | |
Family Households | 639 | 11,007 | 34,851 | |
Non-Family Households | 342 | 4,994 | 15,101 | |
Married Couple | 561 | 8,863 | 28,213 | |
Other Family | 77 | 2,144 | 6,638 | |
Married w/Child | 249 | 3,701 | 11,449 | |
Single Male w/Child | 6 | 338 | 882 | |
Single Female w/Child | 22 | 642 | 2,298 |
Population Change Last Two Decades - Plus Projection
2000 | % | 2010 | % | 2020 | % | 2030 | |
---|---|---|---|---|---|---|---|
Pennsylvania | 12,281,054 | +3 | 12,702,379 | +4 | 13,230,170 | +4 | 13,759,594 |
Bucks County | 597,635 | +5 | 625,249 | +1 | 629,420 | +1 | 637,730 |
Montgomery County | 750,097 | +7 | 799,874 | +5 | 838,883 | +6 | 891,868 |
Total Working Age Population:
Total Households:
Total Working Age Population:
Total Households:
Total Working Age Population:
Total Households: