Retail Space
79 Union Boulevard Totowa, NJ 07512
79 Union Boulevard Totowa, NJ 07512
Details & Description
Property Highlights
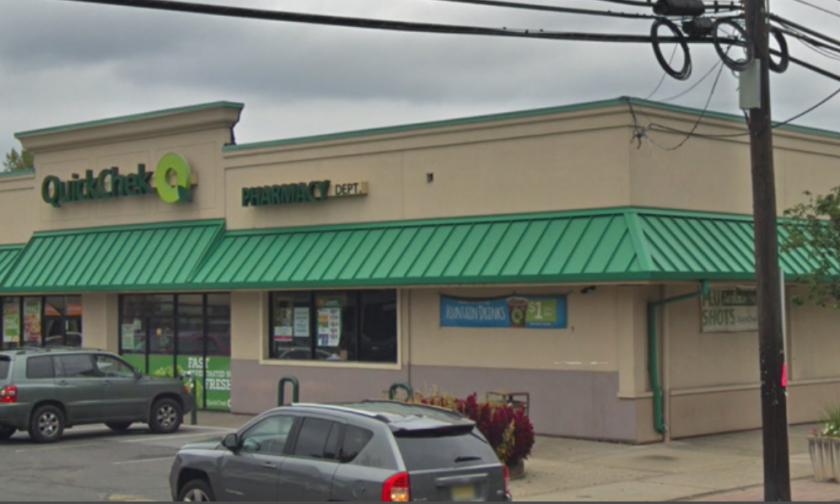
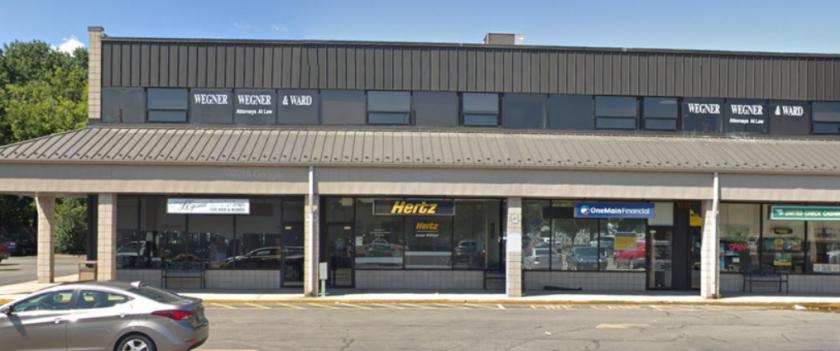
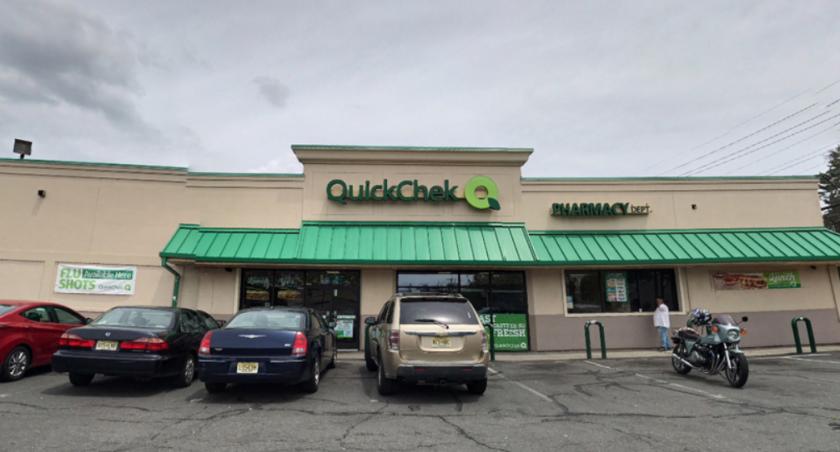
• Located at Thriving Retail Center Anchored by Quick Chek and Valley National Bank
• Abundant Off-Street Parking
Listing Agents

Scott Savastano
O: 973-379-6644
M: 973-464-3800
sgsavastano@blauberg.com
O: 973-379-6644
M: 973-464-3800
sgsavastano@blauberg.com
While we strive to provide the most accurate information, all listing information, and demographic data, is provided by third-parties. As such, MyEListing will not be responsible for the accuracy of the information. It is strongly recommended that you verify all information with the listing agent, and any relevant agencies, prior to making any decisions.