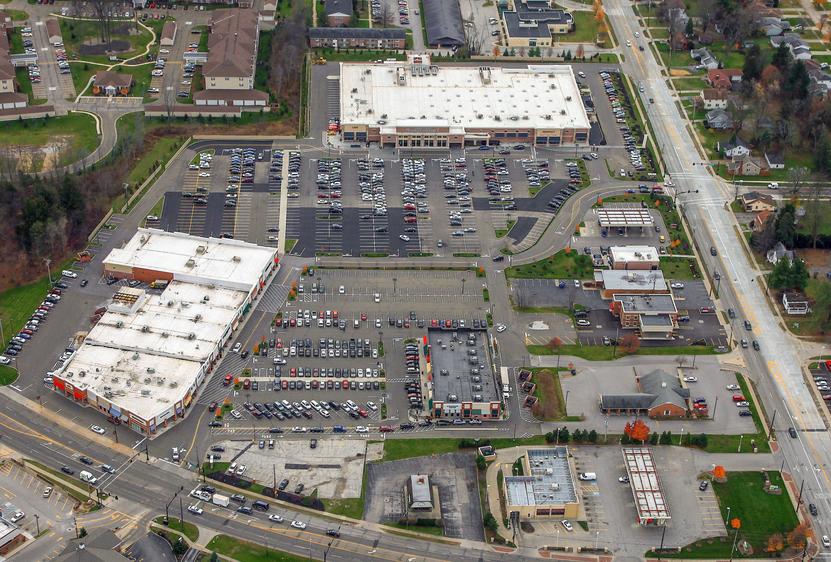
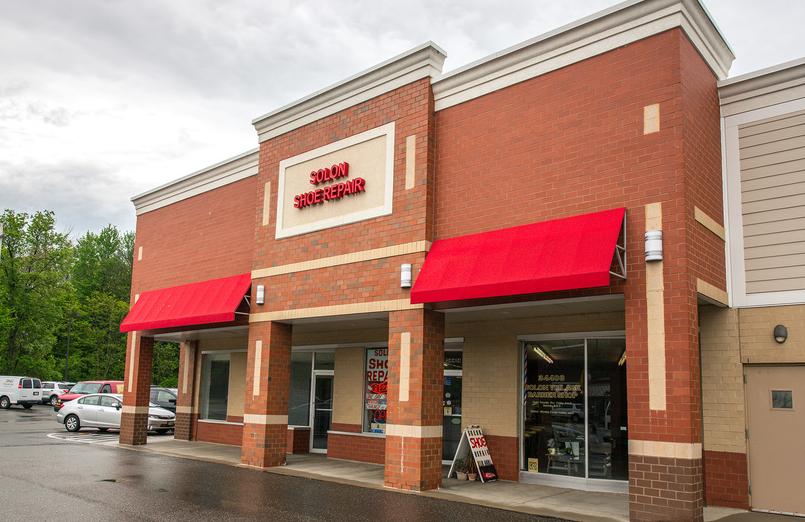
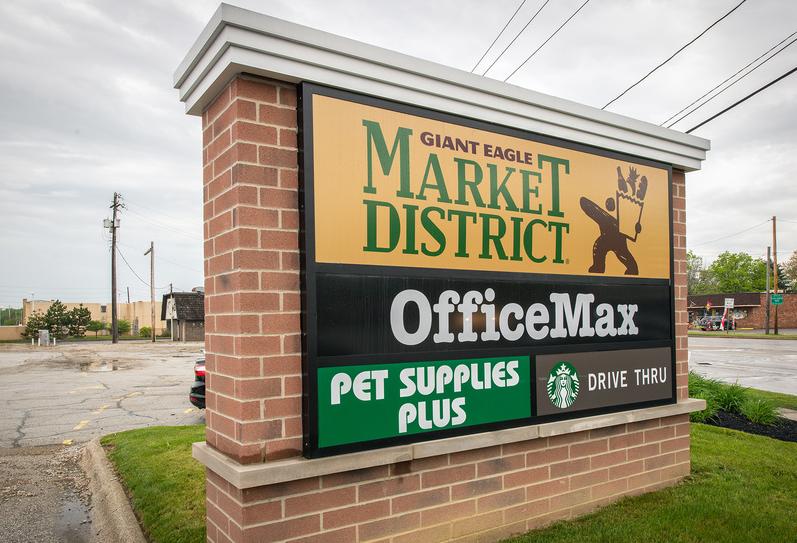
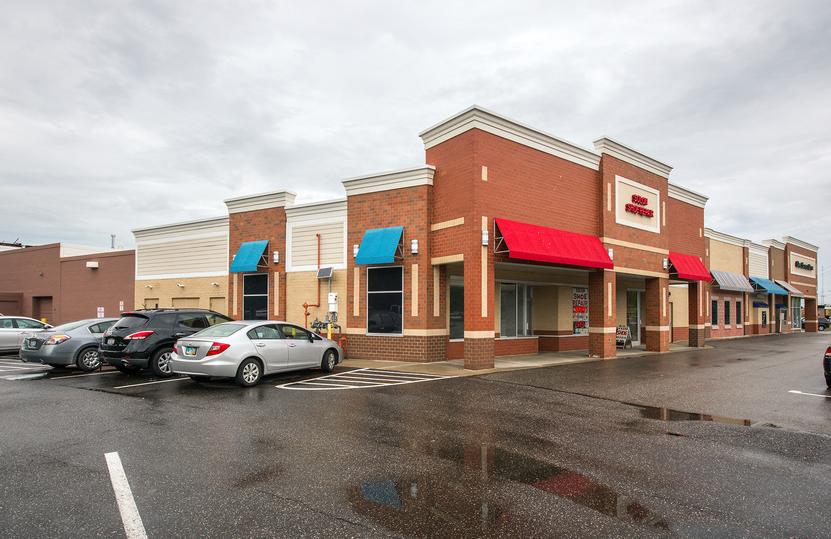
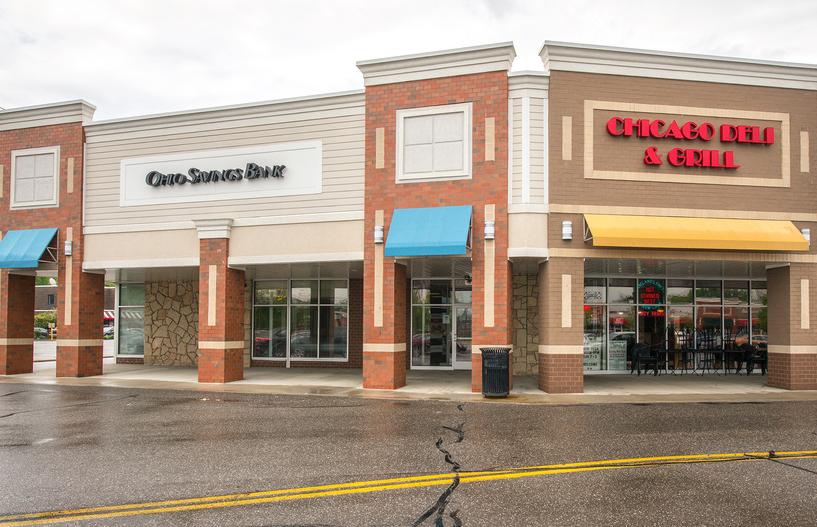
1-Mile | 3-Miles | 5-Miles | ||
---|---|---|---|---|
Total Population | 5,504 | 30,638 | 89,217 | |
Population Median Age | 40 | 41 | 42 | |
Population by Age | 0-9 Yrs | 769 (13%) | 3607 (11%) | 9874 (11%) |
10-19 Yrs | 806 (14%) | 4604 (15%) | 12102 (13%) | |
20-29 Yrs | 331 (6%) | 2146 (7%) | 7674 (8%) | |
30-39 Yrs | 623 (11%) | 3023 (9%) | 9590 (10%) | |
40-49 Yrs | 823 (14%) | 4947 (16%) | 12366 (13%) | |
50-59 Yrs | 914 (16%) | 5042 (16%) | 14379 (16%) | |
60-69 Yrs | 583 (10%) | 3719 (12%) | 11827 (13%) | |
70+ Yrs | 654 (11%) | 3548 (11%) | 11405 (12%) | |
Median HH Income | $80,139 | $107,496 | $78,178 | |
Total Household Income | < 24K | 217 (10%) | 973 (8%) | 5540 (15%) |
25-49K | 437 (21%) | 1572 (13%) | 6640 (18%) | |
50-74K | 330 (15%) | 1491 (12%) | 5629 (15%) | |
75-99K | 254 (12%) | 1314 (11%) | 4843 (13%) | |
100-199K | 585 (28%) | 3833 (33%) | 9330 (25%) | |
200K+ | 250 (12%) | 2314 (20%) | 4868 (13%) | |
Highest Education Level | No Diploma | 211 | 608 | 3090 |
Diploma or GED | 710 | 3257 | 13724 | |
Some College | 635 | 3272 | 11675 | |
Assoc. Degree | 306 | 1360 | 4846 | |
Bachelors Degree | 992 | 6541 | 16898 | |
Higher Degree | 956 | 6206 | 12835 | |
Total Housing Units | 2,171 | 12,006 | 39,188 | |
--Owner-Occupied | 1,549 | 9,694 | 26,962 | |
--Renter-Occupied | 524 | 1,803 | 9,888 | |
Owner-Occupied Values | < 100K | 73 | 331 | 3455 |
100-199K | 615 | 1838 | 7675 | |
200-299K | 502 | 3647 | 7307 | |
300-399K | 156 | 1610 | 3461 | |
400-499K | 150 | 997 | 2141 | |
500K+ | 53 | 1272 | 2923 | |
Total Working Age Population | 4,231 | 23,959 | 71,700 | |
In Work Force | 2,952 | 16,173 | 47,099 | |
Not In Work Force | 1,280 | 7,786 | 24,602 | |
Workforce Employed | 2,871 | 15,690 | 45,277 | |
Workforce Unemployed | 81 | 465 | 1,797 | |
Civlian Workforce | 2,951 | 16,156 | 47,074 | |
Military Workforce | 0 | 18 | 25 | |
Total Households | 2,073 | 11,497 | 36,850 | |
Family Households | 1,527 | 8,729 | 24,358 | |
Non-Family Households | 546 | 2,768 | 12,492 | |
Married Couple | 1,236 | 7,438 | 18,777 | |
Other Family | 292 | 1,291 | 5,582 | |
Married w/Child | 565 | 3,320 | 7,576 | |
Single Male w/Child | 16 | 175 | 648 | |
Single Female w/Child | 145 | 486 | 2,133 |
Population Change Last Two Decades - Plus Projection
2000 | % | 2010 | % | 2020 | % | 2030 | |
---|---|---|---|---|---|---|---|
Ohio | 11,353,140 | +2 | 11,536,504 | 0 | 11,574,870 | 0 | 11,615,100 |
Cuyahoga County | 1,393,978 | -8 | 1,280,122 | -6 | 1,209,550 | -5 | 1,154,210 |
Geauga County | 90,895 | +3 | 93,389 | 0 | 93,510 | +2 | 94,930 |
Portage County | 152,061 | +6 | 161,419 | 0 | 161,410 | -2 | 158,930 |
Summit County | 542,899 | 0 | 541,781 | -1 | 534,150 | -1 | 528,990 |
Total Working Age Population:
Total Households:
Total Working Age Population:
Total Households:
Total Working Age Population:
Total Households: