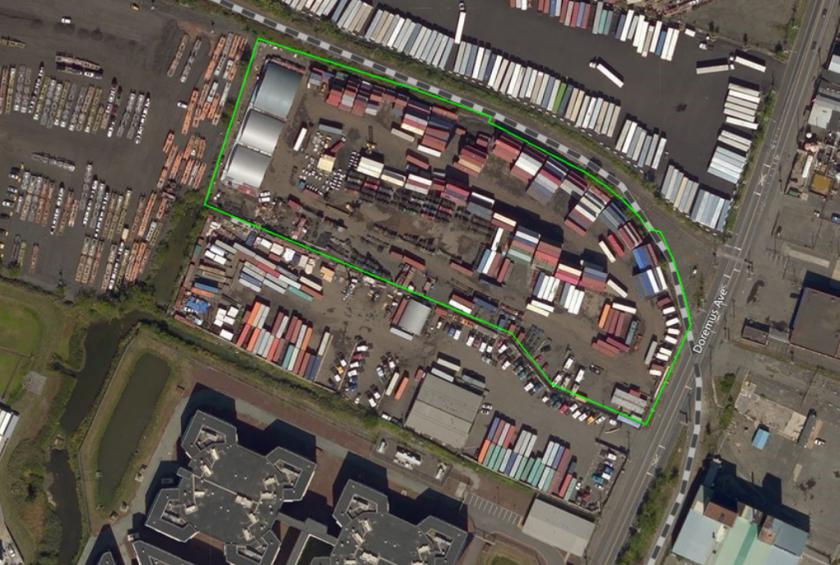
Lot Size: ±6 Acres
Rail: Conrail Line Adjacent to Site
Zoning: I-3 (Heavy Third Industrial)
Sheet piles were placed at border to support raised elevations above the street
Site is NOT included in City of Newark 2019 Condemnation Redevelopment Area
Utilities at site (sewer and electric)
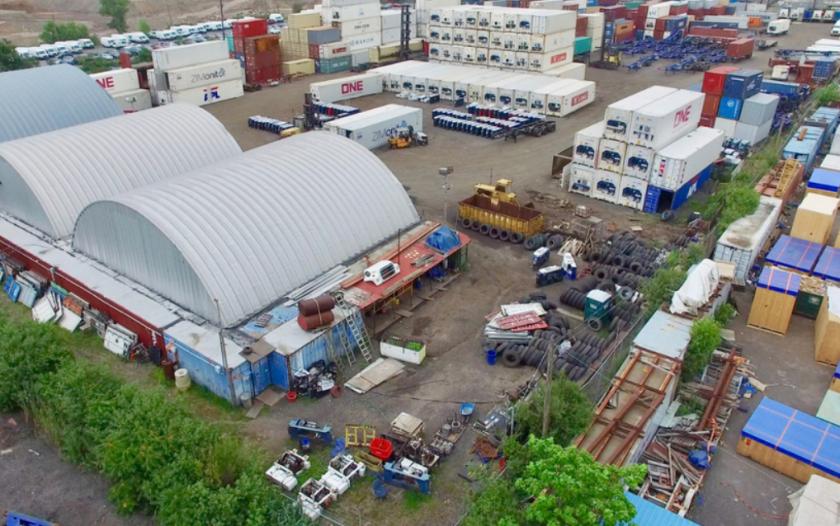
Lot is graded, fenced and lit
Site is raised out of the flood zone (above the 100-year zone)
Site has storm water drainage and fire hydrants
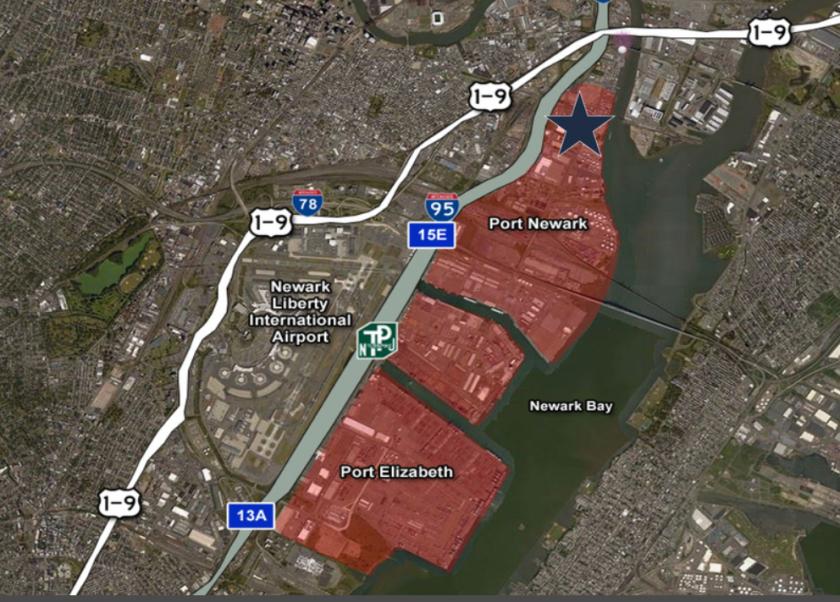
Site is inside a Qualified Opportunity Zone
No part of this information may be copied, reproduced, repurposed, or screen-captured for any commercial purpose without prior written authorization from MyEListing.
While we strive to provide the most accurate information, all listing information, and demographic data, is provided by third-parties. As such, MyEListing will not be responsible for the accuracy of the information. It is strongly recommended that you verify all information with the listing agent, and any relevant agencies, prior to making any decisions.
What kind of Land is the propery at 303 Doremus Avenue?
The property at 303 Doremus Avenue Newark, NJ 07105 is listed as a Industrial Land Land property
What is the population within 1 mile of 303 Doremus Avenue in Newark?
The population within 1 mile of 303 Doremus Avenue Newark, NJ 07105 is 6,733 people.
Who do I contact for questions about 303 Doremus Avenue?
You should contact the listing agent,
Jason M. Crimmins , for any details regarding this commercial listing.