Industrial Properties
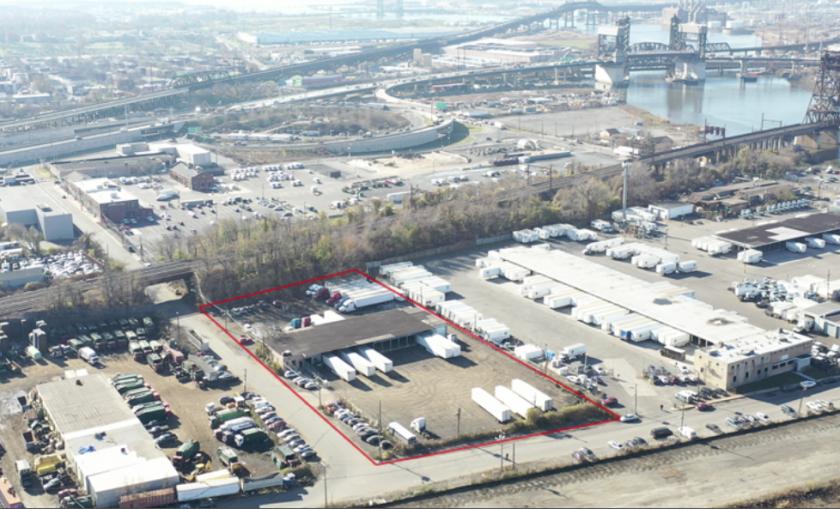
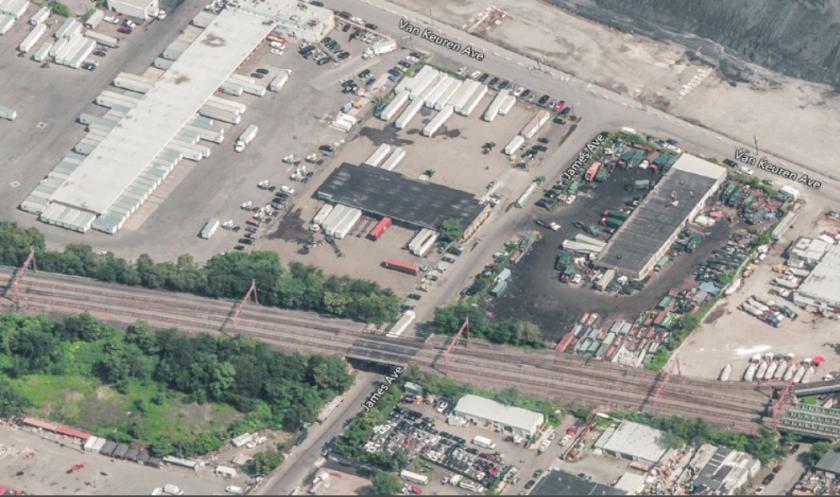
125 James Avenue Jersey City, NJ 07306
125 James Avenue Jersey City, NJ 07306

Details & Description
Property Highlights
- • 30-Door Terminal
- • 2.17-Acre Lot Block 7404, Lot 12
- • 1,200 SF Office Space
- • Clear Column Spacing
- • Parking for 70 Trailers
- • Zoned Heavy Industrial
Listing Agents

Jason M. Crimmins
O: 973-379-6644
M: 973-568-6611
jmcrimmins@blauberg.com
O: 973-379-6644
M: 973-568-6611
jmcrimmins@blauberg.com
While we strive to provide the most accurate information, all listing information, and demographic data, is provided by third-parties. As such, MyEListing will not be responsible for the accuracy of the information. It is strongly recommended that you verify all information with the listing agent, and any relevant agencies, prior to making any decisions.