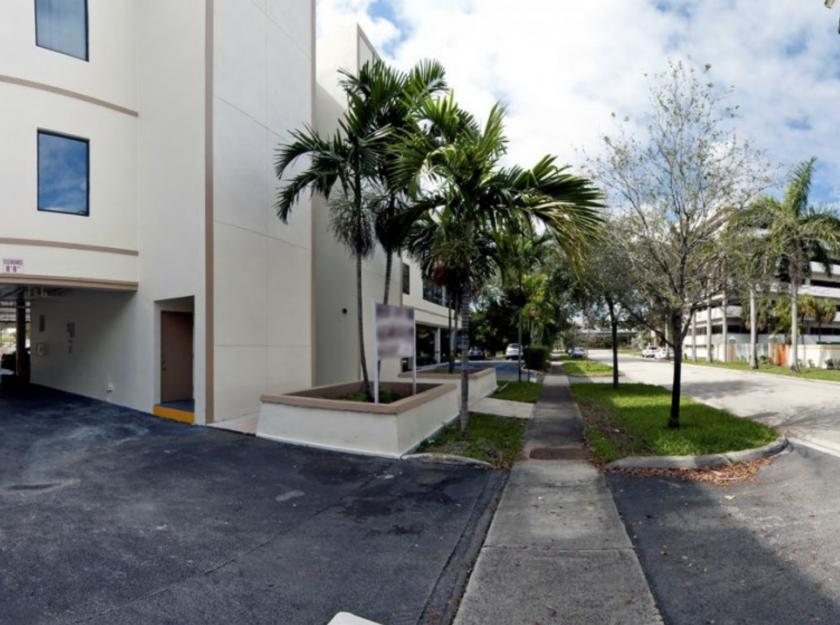
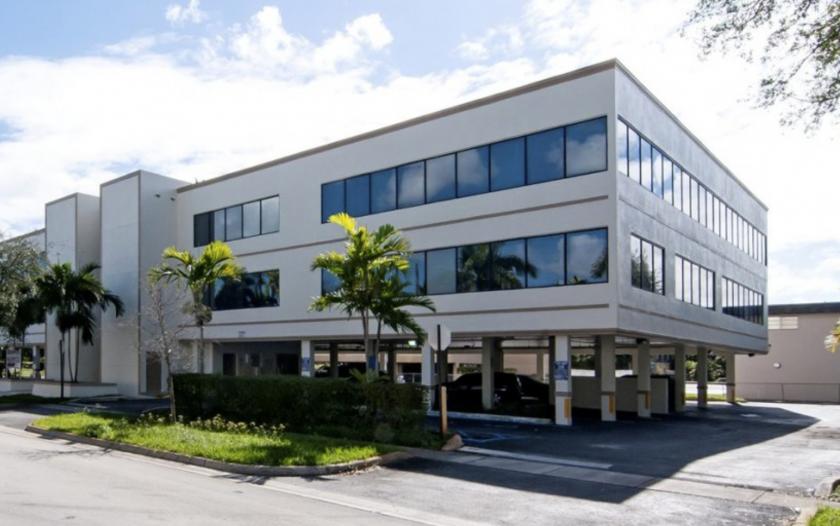
1-Mile | 3-Miles | 5-Miles | ||
---|---|---|---|---|
Total Population | 18,236 | 221,000 | 560,606 | |
Population Median Age | 36 | 38 | 39 | |
Population by Age | 0-9 Yrs | 3024 (16%) | 27980 (12%) | 69830 (12%) |
10-19 Yrs | 1737 (9%) | 27356 (12%) | 67548 (12%) | |
20-29 Yrs | 3006 (16%) | 33405 (15%) | 77439 (13%) | |
30-39 Yrs | 2712 (14%) | 32100 (14%) | 77346 (13%) | |
40-49 Yrs | 2148 (11%) | 28031 (12%) | 72742 (12%) | |
50-59 Yrs | 2126 (11%) | 28850 (13%) | 74777 (13%) | |
60-69 Yrs | 1842 (10%) | 23433 (10%) | 61775 (11%) | |
70+ Yrs | 1641 (8%) | 19845 (8%) | 59148 (10%) | |
Median HH Income | $46,162 | $43,805 | $46,123 | |
Total Household Income | < 24K | 1256 (24%) | 17801 (26%) | 48643 (26%) |
25-49K | 1454 (28%) | 20263 (30%) | 50094 (27%) | |
50-74K | 1202 (23%) | 13710 (20%) | 33333 (18%) | |
75-99K | 403 (7%) | 6409 (9%) | 18881 (10%) | |
100-199K | 677 (13%) | 8101 (12%) | 24405 (13%) | |
200K+ | 76 (1%) | 1189 (1%) | 8445 (4%) | |
Highest Education Level | No Diploma | 2534 | 29307 | 67373 |
Diploma or GED | 4063 | 49606 | 116590 | |
Some College | 2282 | 28760 | 75453 | |
Assoc. Degree | 1127 | 14233 | 37016 | |
Bachelors Degree | 1777 | 18558 | 56780 | |
Higher Degree | 547 | 9173 | 33336 | |
Total Housing Units | 5,870 | 74,939 | 223,537 | |
--Owner-Occupied | 2,737 | 36,533 | 102,063 | |
--Renter-Occupied | 2,332 | 30,939 | 81,738 | |
Owner-Occupied Values | < 100K | 368 | 6438 | 12866 |
100-199K | 862 | 13408 | 33471 | |
200-299K | 1176 | 10820 | 27393 | |
300-399K | 233 | 3843 | 11013 | |
400-499K | 45 | 952 | 4130 | |
500K+ | 52 | 1072 | 13190 | |
Total Working Age Population | 14,173 | 176,525 | 450,502 | |
In Work Force | 8,794 | 113,141 | 282,231 | |
Not In Work Force | 5,379 | 63,384 | 168,271 | |
Workforce Employed | 8,027 | 104,680 | 261,854 | |
Workforce Unemployed | 767 | 8,356 | 20,225 | |
Civlian Workforce | 8,794 | 113,037 | 282,080 | |
Military Workforce | 0 | 104 | 151 | |
Total Households | 5,069 | 67,473 | 183,802 | |
Family Households | 3,728 | 46,120 | 121,132 | |
Non-Family Households | 1,340 | 21,353 | 62,670 | |
Married Couple | 2,019 | 24,638 | 69,394 | |
Other Family | 1,709 | 21,482 | 51,738 | |
Married w/Child | 866 | 9,633 | 25,812 | |
Single Male w/Child | 95 | 1,938 | 5,135 | |
Single Female w/Child | 628 | 7,009 | 16,925 |
Population Change Last Two Decades - Plus Projection
2000 | % | 2010 | % | 2020 | % | 2030 | |
---|---|---|---|---|---|---|---|
Florida | 15,982,378 | +18 | 18,801,310 | +14 | 21,517,610 | +13 | 24,340,457 |
Broward County | 1,623,018 | +8 | 1,748,066 | +11 | 1,942,686 | +9 | 2,120,334 |
Miami-Dade County | 2,253,362 | +11 | 2,496,435 | +15 | 2,861,579 | +11 | 3,190,242 |
Total Working Age Population:
Total Households:
Total Working Age Population:
Total Households:
Total Working Age Population:
Total Households: