Flex-Office-Warehouse
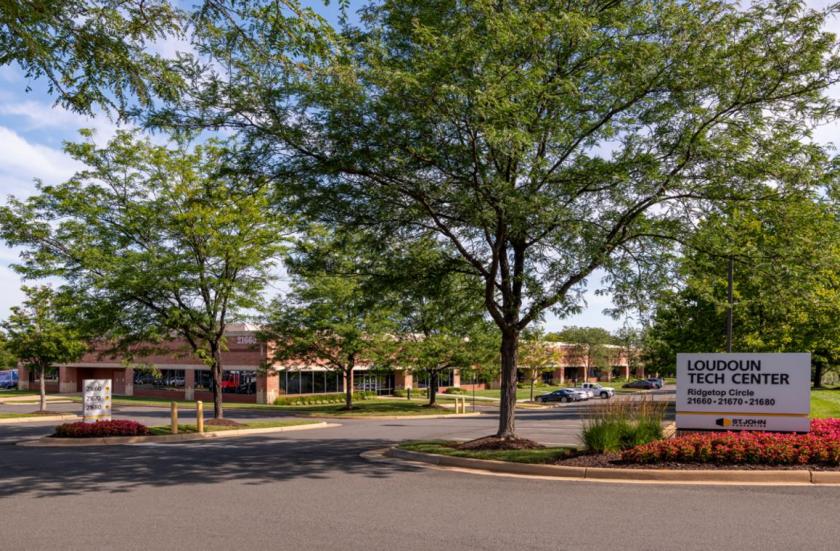
21660 Ridgetop Circle Sterling, VA 20166
21660 Ridgetop Circle Sterling, VA 20166
Details & Description
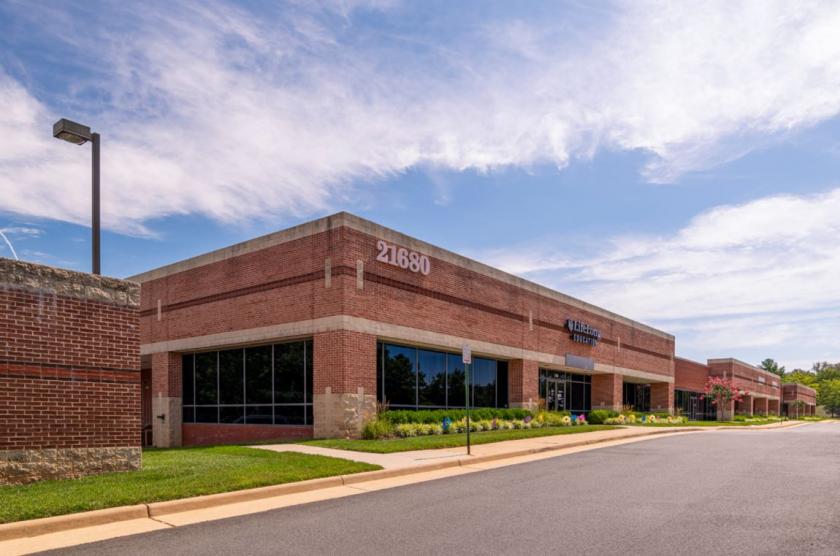
Additional Photos


Listing Agents

Danny Foit
O: 240-446-7985
dfoit@sjpi.com
O: 240-446-7985
dfoit@sjpi.com
While we strive to provide the most accurate information, all listing information, and demographic data, is provided by third-parties. As such, MyEListing will not be responsible for the accuracy of the information. It is strongly recommended that you verify all information with the listing agent, and any relevant agencies, prior to making any decisions.


