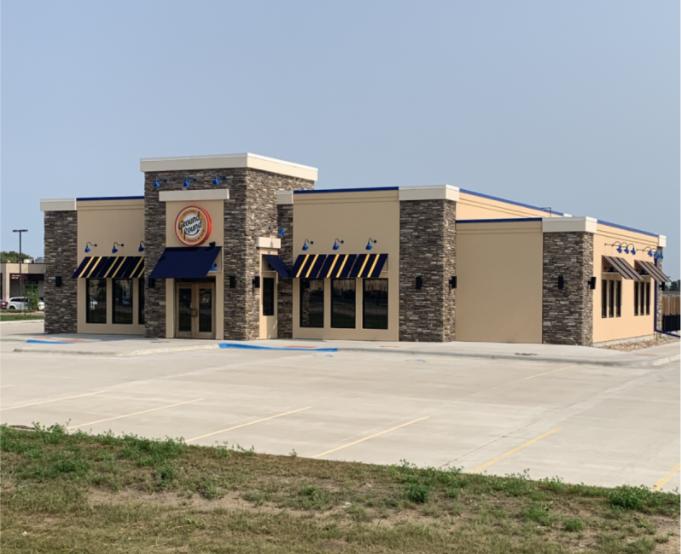
Retail Space
2233 Kansas Avenue Southeast Huron, SD 57350
2233 Kansas Avenue Southeast Huron, SD 57350
Details & Description
Property Highlights
- • Sale price is a tremendous deal for this property
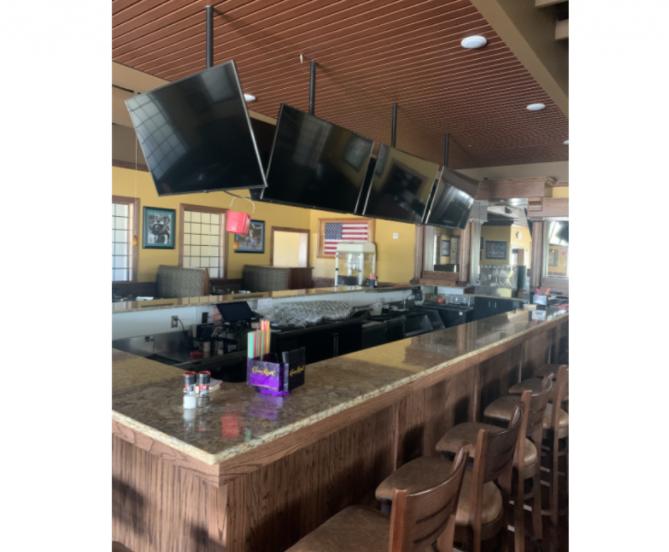
- • Dining Room seating for 124
- • Banquet Room seating for 72
- • Bar Area seating for 84
- • Total seating capacity is 254
- • 91 dedicated parking stalls
Listing Agents

Scott Blount
O: 605-231-1882
scott@lloydcompanies.com
O: 605-231-1882
scott@lloydcompanies.com
While we strive to provide the most accurate information, all listing information, and demographic data, is provided by third-parties. As such, MyEListing will not be responsible for the accuracy of the information. It is strongly recommended that you verify all information with the listing agent, and any relevant agencies, prior to making any decisions.