Retail Space
I-95 and Route 273 Newark, DE 19702
I-95 and Route 273 Newark, DE 19702

Details & Description
Property Highlights
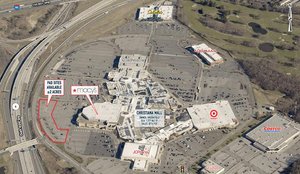
• Area retailers include Target, JCPenney, Boscovs, Staples, Old Navy, Nordstrom Macys
• New shopping center development located near Christiana Mall
Listing Agents

Joe Dougherty
O: 610-260-2670
M: 610-580-7663
jdougherty@metrocommercial.com
O: 610-260-2670
M: 610-580-7663
jdougherty@metrocommercial.com
While we strive to provide the most accurate information, all listing information, and demographic data, is provided by third-parties. As such, MyEListing will not be responsible for the accuracy of the information. It is strongly recommended that you verify all information with the listing agent, and any relevant agencies, prior to making any decisions.