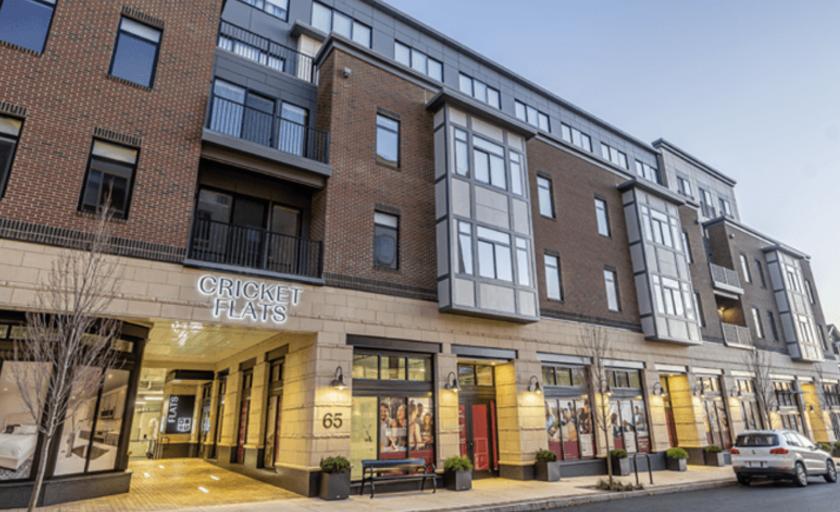
1-Mile | 3-Miles | 5-Miles | ||
---|---|---|---|---|
Total Population | 17,356 | 124,219 | 430,030 | |
Population Median Age | 40 | 39 | 38 | |
Population by Age | 0-9 Yrs | 2019 (11%) | 15458 (12%) | 52115 (12%) |
10-19 Yrs | 2150 (12%) | 18677 (15%) | 56360 (13%) | |
20-29 Yrs | 2184 (12%) | 14999 (12%) | 67485 (15%) | |
30-39 Yrs | 2490 (14%) | 14066 (11%) | 54363 (12%) | |
40-49 Yrs | 2352 (13%) | 15901 (12%) | 50684 (11%) | |
50-59 Yrs | 2388 (13%) | 16534 (13%) | 56419 (13%) | |
60-69 Yrs | 1773 (10%) | 14582 (11%) | 47752 (11%) | |
70+ Yrs | 1999 (11%) | 14001 (11%) | 44852 (10%) | |
Median HH Income | $105,291 | $102,391 | $65,698 | |
Total Household Income | < 24K | 917 (12%) | 5110 (11%) | 34086 (20%) |
25-49K | 982 (13%) | 6468 (14%) | 31474 (19%) | |
50-74K | 931 (12%) | 6036 (13%) | 24383 (14%) | |
75-99K | 601 (8%) | 4858 (10%) | 17784 (10%) | |
100-199K | 2169 (30%) | 12884 (28%) | 35332 (21%) | |
200K+ | 1630 (22%) | 10382 (22%) | 19622 (12%) | |
Highest Education Level | No Diploma | 347 | 2735 | 21385 |
Diploma or GED | 1248 | 12007 | 72633 | |
Some College | 1194 | 10138 | 48848 | |
Assoc. Degree | 493 | 4478 | 17542 | |
Bachelors Degree | 3706 | 23771 | 69589 | |
Higher Degree | 4859 | 28956 | 60361 | |
Total Housing Units | 7,563 | 48,263 | 181,421 | |
--Owner-Occupied | 4,486 | 33,389 | 101,292 | |
--Renter-Occupied | 2,743 | 12,350 | 61,390 | |
Owner-Occupied Values | < 100K | 93 | 1073 | 17055 |
100-199K | 294 | 5249 | 24385 | |
200-299K | 1050 | 5908 | 19985 | |
300-399K | 940 | 6609 | 14689 | |
400-499K | 525 | 3769 | 7268 | |
500K+ | 1583 | 10781 | 17911 | |
Total Working Age Population | 14,108 | 99,107 | 345,878 | |
In Work Force | 9,710 | 64,857 | 220,739 | |
Not In Work Force | 4,398 | 34,250 | 125,139 | |
Workforce Employed | 9,404 | 61,726 | 207,187 | |
Workforce Unemployed | 307 | 3,097 | 13,487 | |
Civlian Workforce | 9,710 | 64,824 | 220,674 | |
Military Workforce | 0 | 33 | 65 | |
Total Households | 7,230 | 45,739 | 162,682 | |
Family Households | 4,299 | 30,939 | 99,904 | |
Non-Family Households | 2,931 | 14,800 | 62,778 | |
Married Couple | 3,526 | 24,788 | 65,559 | |
Other Family | 773 | 6,151 | 34,345 | |
Married w/Child | 1,583 | 11,336 | 26,913 | |
Single Male w/Child | 127 | 813 | 3,059 | |
Single Female w/Child | 325 | 2,427 | 13,470 |
Population Change Last Two Decades - Plus Projection
2000 | % | 2010 | % | 2020 | % | 2030 | |
---|---|---|---|---|---|---|---|
Pennsylvania | 12,281,054 | +3 | 12,702,379 | +4 | 13,230,170 | +4 | 13,759,594 |
Bucks County | 597,635 | +5 | 625,249 | +1 | 629,420 | +1 | 637,730 |
Chester County | 433,501 | +15 | 498,886 | +7 | 533,837 | +7 | 573,576 |
Delaware County | 550,864 | +1 | 558,979 | +5 | 588,436 | +6 | 622,307 |
Montgomery County | 750,097 | +7 | 799,874 | +5 | 838,883 | +6 | 891,868 |
Philadelphia County | 1,517,550 | +1 | 1,526,006 | +8 | 1,653,729 | +6 | 1,753,054 |
Total Working Age Population:
Total Households:
Total Working Age Population:
Total Households:
Total Working Age Population:
Total Households: