Industrial Properties
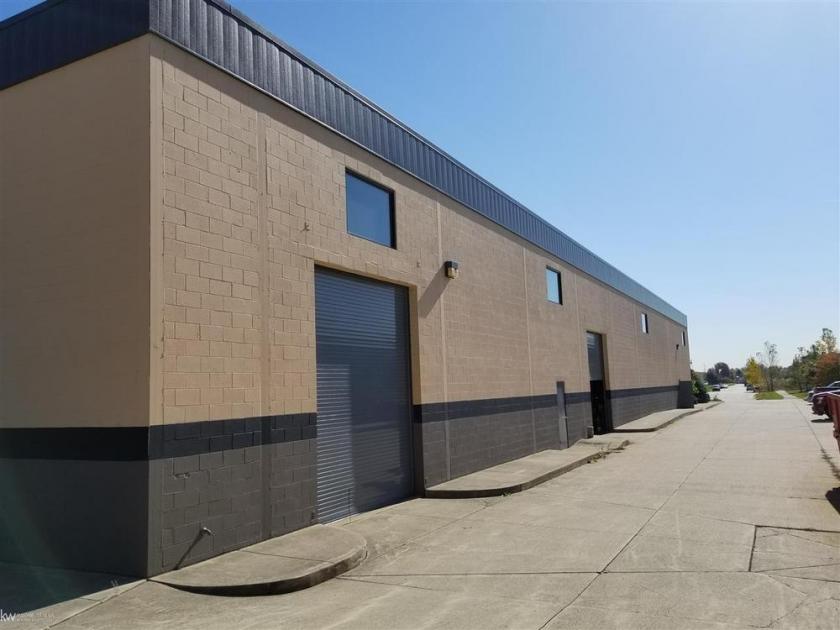
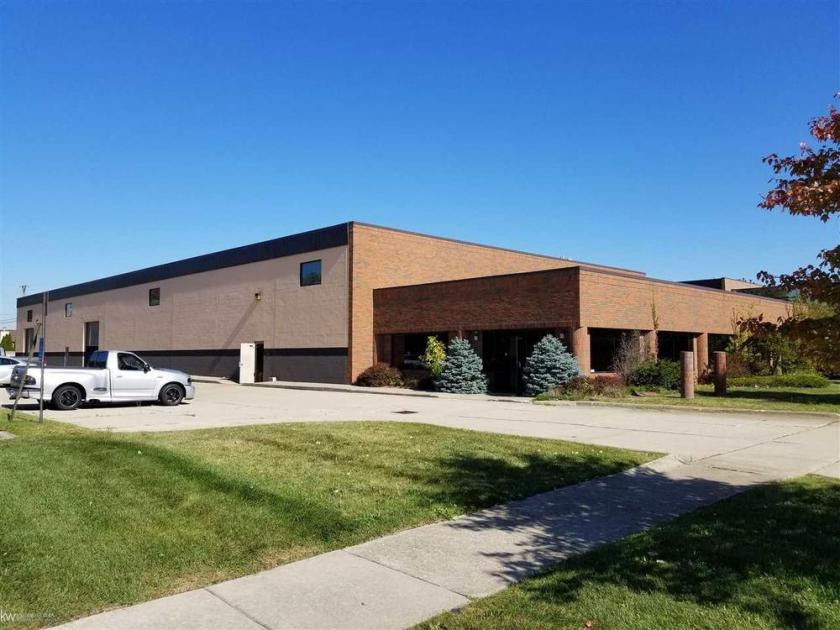
15747 Leone Drive Macomb, MI 48042
15747 Leone Drive Macomb, MI 48042
Details & Description
Property Highlights
- • Updated high efficiency florescent light fixtures.
- • 22 Foot ceilings in the warehouse
- • Mezzanine Storage
Listing Agents

Jack Robson
KW Commercial
O: 586-949-0200
M: 810-941-7946
jack_robson@sbcglobal.net
KW Commercial
O: 586-949-0200
M: 810-941-7946
jack_robson@sbcglobal.net
While we strive to provide the most accurate information, all listing information, and demographic data, is provided by third-parties. As such, MyEListing will not be responsible for the accuracy of the information. It is strongly recommended that you verify all information with the listing agent, and any relevant agencies, prior to making any decisions.