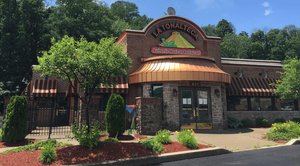
1-Mile | 3-Miles | 5-Miles | ||
---|---|---|---|---|
Total Population | 5,509 | 76,627 | 141,896 | |
Population Median Age | 44 | 40 | 39 | |
Population by Age | 0-9 Yrs | 507 (9%) | 8236 (10%) | 16557 (11%) |
10-19 Yrs | 491 (8%) | 8936 (11%) | 17963 (12%) | |
20-29 Yrs | 785 (14%) | 12128 (15%) | 21321 (15%) | |
30-39 Yrs | 724 (13%) | 10080 (13%) | 17185 (12%) | |
40-49 Yrs | 608 (11%) | 8008 (10%) | 16234 (11%) | |
50-59 Yrs | 642 (11%) | 10602 (13%) | 19378 (13%) | |
60-69 Yrs | 932 (16%) | 9508 (12%) | 16952 (11%) | |
70+ Yrs | 820 (14%) | 9128 (11%) | 16306 (11%) | |
Median HH Income | $53,600 | $47,270 | $45,856 | |
Total Household Income | < 24K | 681 (24%) | 8611 (25%) | 16059 (26%) |
25-49K | 620 (22%) | 9064 (27%) | 16007 (26%) | |
50-74K | 647 (23%) | 6768 (20%) | 10938 (18%) | |
75-99K | 310 (11%) | 3935 (11%) | 6077 (10%) | |
100-199K | 460 (16%) | 4431 (13%) | 8543 (14%) | |
200K+ | 62 (2%) | 700 (2%) | 1963 (3%) | |
Highest Education Level | No Diploma | 277 | 4512 | 9611 |
Diploma or GED | 1449 | 19945 | 34382 | |
Some College | 663 | 8136 | 14944 | |
Assoc. Degree | 375 | 4624 | 8732 | |
Bachelors Degree | 946 | 10827 | 18511 | |
Higher Degree | 619 | 5927 | 10964 | |
Total Housing Units | 3,036 | 37,769 | 66,848 | |
--Owner-Occupied | 1,901 | 18,641 | 34,449 | |
--Renter-Occupied | 879 | 14,869 | 25,138 | |
Owner-Occupied Values | < 100K | 539 | 7048 | 13296 |
100-199K | 1181 | 8615 | 13374 | |
200-299K | 113 | 1972 | 4888 | |
300-399K | 40 | 401 | 1174 | |
400-499K | 4 | 211 | 568 | |
500K+ | 24 | 394 | 1149 | |
Total Working Age Population | 4,679 | 63,173 | 115,106 | |
In Work Force | 2,943 | 38,546 | 69,094 | |
Not In Work Force | 1,737 | 24,626 | 46,012 | |
Workforce Employed | 2,749 | 36,342 | 64,588 | |
Workforce Unemployed | 188 | 2,087 | 4,328 | |
Civlian Workforce | 2,937 | 38,429 | 68,916 | |
Military Workforce | 6 | 117 | 178 | |
Total Households | 2,780 | 33,510 | 59,587 | |
Family Households | 1,401 | 18,031 | 33,447 | |
Non-Family Households | 1,378 | 15,479 | 26,140 | |
Married Couple | 938 | 12,106 | 21,978 | |
Other Family | 463 | 5,925 | 11,469 | |
Married w/Child | 293 | 4,119 | 7,733 | |
Single Male w/Child | 113 | 1,031 | 1,840 | |
Single Female w/Child | 166 | 2,369 | 4,743 |
Population Change Last Two Decades - Plus Projection
2000 | % | 2010 | % | 2020 | % | 2030 | |
---|---|---|---|---|---|---|---|
Pennsylvania | 12,281,054 | +3 | 12,702,379 | +4 | 13,230,170 | +4 | 13,759,594 |
Erie County | 280,843 | 0 | 280,566 | +5 | 294,425 | +4 | 305,877 |
Total Working Age Population:
Total Households:
Total Working Age Population:
Total Households:
Total Working Age Population:
Total Households: