Retail Space
697 Allegheny Boulevard Franklin, PA 16323
697 Allegheny Boulevard Franklin, PA 16323
Details & Description
Property Highlights
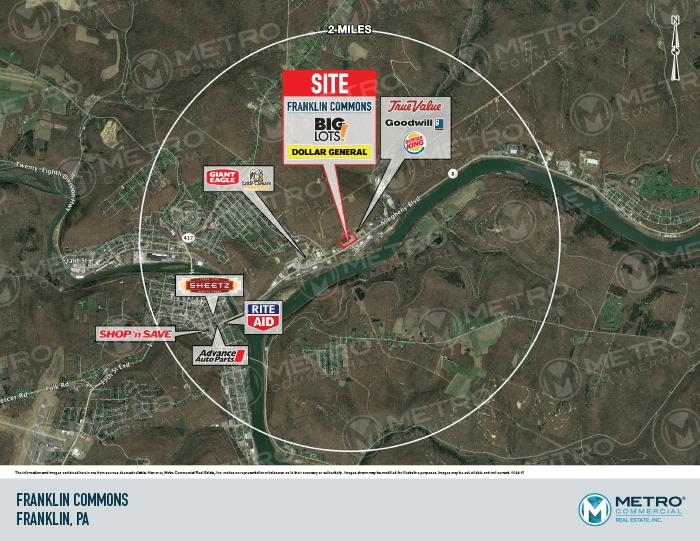
• Strong Traffic Counts of 18,123 Cars Per Day Directly in Front of Property
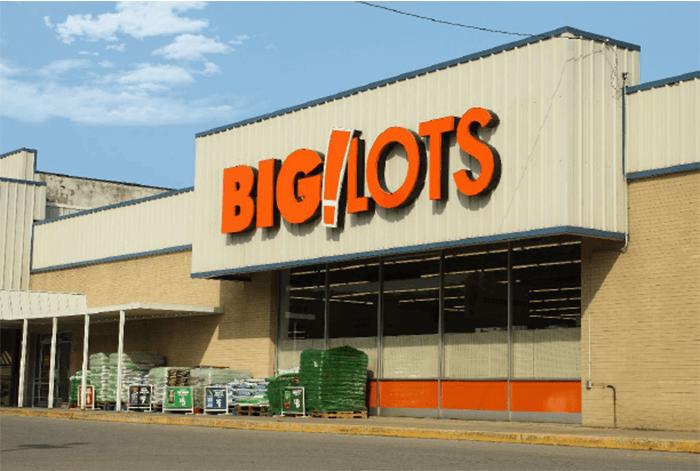
• Area retailers include Giant Eagle, Kmart, Sherwin Williams, and Sheetz
Listing Agents

Greg Jones
O: 610-234-6491
M: 484-948-5217
gjones@jcbarprop.com
O: 610-234-6491
M: 484-948-5217
gjones@jcbarprop.com
While we strive to provide the most accurate information, all listing information, and demographic data, is provided by third-parties. As such, MyEListing will not be responsible for the accuracy of the information. It is strongly recommended that you verify all information with the listing agent, and any relevant agencies, prior to making any decisions.