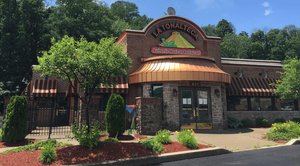
1-Mile | 3-Miles | 5-Miles | ||
---|---|---|---|---|
Total Population | 5,058 | 64,144 | 178,180 | |
Population Median Age | 44 | 43 | 42 | |
Population by Age | 0-9 Yrs | 445 (8%) | 7131 (11%) | 19136 (10%) |
10-19 Yrs | 523 (10%) | 6180 (9%) | 18580 (10%) | |
20-29 Yrs | 694 (13%) | 7560 (11%) | 22382 (12%) | |
30-39 Yrs | 724 (14%) | 8477 (13%) | 23302 (13%) | |
40-49 Yrs | 410 (8%) | 7385 (11%) | 20555 (11%) | |
50-59 Yrs | 686 (13%) | 8185 (12%) | 24351 (13%) | |
60-69 Yrs | 673 (13%) | 9838 (15%) | 25709 (14%) | |
70+ Yrs | 903 (17%) | 9388 (14%) | 24165 (13%) | |
Median HH Income | $59,946 | $52,305 | $49,817 | |
Total Household Income | < 24K | 364 (15%) | 6449 (21%) | 20544 (24%) |
25-49K | 570 (24%) | 7911 (26%) | 21195 (25%) | |
50-74K | 474 (20%) | 5976 (19%) | 15436 (18%) | |
75-99K | 277 (11%) | 3768 (12%) | 9600 (11%) | |
100-199K | 584 (25%) | 4946 (16%) | 13947 (16%) | |
200K+ | 55 (2%) | 894 (2%) | 2501 (3%) | |
Highest Education Level | No Diploma | 157 | 2659 | 7381 |
Diploma or GED | 1066 | 14230 | 40222 | |
Some College | 927 | 9621 | 25036 | |
Assoc. Degree | 357 | 5129 | 14252 | |
Bachelors Degree | 798 | 9661 | 25934 | |
Higher Degree | 558 | 6480 | 18149 | |
Total Housing Units | 2,566 | 33,849 | 96,185 | |
--Owner-Occupied | 1,441 | 18,266 | 50,233 | |
--Renter-Occupied | 885 | 11,677 | 32,990 | |
Owner-Occupied Values | < 100K | 539 | 8672 | 23700 |
100-199K | 669 | 7185 | 19213 | |
200-299K | 133 | 1669 | 4638 | |
300-399K | 75 | 484 | 1516 | |
400-499K | 6 | 68 | 443 | |
500K+ | 20 | 188 | 723 | |
Total Working Age Population | 4,207 | 53,333 | 147,357 | |
In Work Force | 2,480 | 33,917 | 94,077 | |
Not In Work Force | 1,727 | 19,416 | 53,280 | |
Workforce Employed | 2,388 | 31,934 | 88,094 | |
Workforce Unemployed | 92 | 1,973 | 5,925 | |
Civlian Workforce | 2,480 | 33,907 | 94,019 | |
Military Workforce | 0 | 10 | 58 | |
Total Households | 2,326 | 29,944 | 83,222 | |
Family Households | 1,297 | 16,727 | 45,713 | |
Non-Family Households | 1,029 | 13,216 | 37,509 | |
Married Couple | 1,011 | 10,845 | 29,741 | |
Other Family | 286 | 5,882 | 15,972 | |
Married w/Child | 328 | 3,386 | 9,436 | |
Single Male w/Child | 13 | 527 | 1,502 | |
Single Female w/Child | 115 | 2,457 | 6,639 |
Population Change Last Two Decades - Plus Projection
2000 | % | 2010 | % | 2020 | % | 2030 | |
---|---|---|---|---|---|---|---|
Pennsylvania | 12,281,054 | +3 | 12,702,379 | +4 | 13,230,170 | +4 | 13,759,594 |
Allegheny County | 1,281,666 | -5 | 1,223,348 | +3 | 1,265,919 | +3 | 1,307,654 |
Washington County | 202,897 | +2 | 207,820 | 0 | 206,942 | 0 | 207,065 |
Westmoreland County | 369,993 | -1 | 365,169 | -2 | 358,574 | -1 | 354,298 |
Total Working Age Population:
Total Households:
Total Working Age Population:
Total Households:
Total Working Age Population:
Total Households: