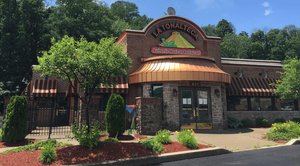
1-Mile | 3-Miles | 5-Miles | ||
---|---|---|---|---|
Total Population | 8,814 | 57,764 | 125,213 | |
Population Median Age | 41 | 40 | 41 | |
Population by Age | 0-9 Yrs | 890 (10%) | 6942 (12%) | 14554 (11%) |
10-19 Yrs | 912 (10%) | 6100 (10%) | 13747 (10%) | |
20-29 Yrs | 1304 (14%) | 7898 (13%) | 16274 (12%) | |
30-39 Yrs | 1053 (11%) | 7281 (12%) | 16114 (12%) | |
40-49 Yrs | 1111 (12%) | 7137 (12%) | 15906 (12%) | |
50-59 Yrs | 1562 (17%) | 8701 (15%) | 18487 (14%) | |
60-69 Yrs | 1119 (12%) | 7604 (13%) | 16063 (12%) | |
70+ Yrs | 862 (9%) | 6102 (10%) | 14069 (11%) | |
Median HH Income | $83,496 | $75,261 | $74,144 | |
Total Household Income | < 24K | 331 (10%) | 3555 (15%) | 7566 (15%) |
25-49K | 520 (15%) | 3887 (17%) | 8812 (18%) | |
50-74K | 589 (18%) | 3743 (16%) | 8100 (16%) | |
75-99K | 546 (16%) | 3017 (13%) | 6448 (13%) | |
100-199K | 997 (30%) | 6392 (28%) | 13374 (27%) | |
200K+ | 269 (8%) | 1839 (8%) | 4112 (8%) | |
Highest Education Level | No Diploma | 518 | 2918 | 6947 |
Diploma or GED | 2379 | 13691 | 31503 | |
Some College | 1288 | 8109 | 16908 | |
Assoc. Degree | 624 | 4070 | 7842 | |
Bachelors Degree | 1215 | 8591 | 18054 | |
Higher Degree | 440 | 3963 | 8255 | |
Total Housing Units | 3,437 | 24,353 | 52,926 | |
--Owner-Occupied | 2,646 | 16,196 | 35,405 | |
--Renter-Occupied | 606 | 6,237 | 13,007 | |
Owner-Occupied Values | < 100K | 69 | 991 | 2794 |
100-199K | 1448 | 7249 | 15532 | |
200-299K | 948 | 5198 | 10995 | |
300-399K | 127 | 2117 | 4574 | |
400-499K | 15 | 397 | 897 | |
500K+ | 39 | 244 | 612 | |
Total Working Age Population | 7,298 | 47,075 | 102,135 | |
In Work Force | 5,075 | 31,295 | 67,759 | |
Not In Work Force | 2,223 | 15,780 | 34,376 | |
Workforce Employed | 4,867 | 29,691 | 64,029 | |
Workforce Unemployed | 208 | 1,595 | 3,713 | |
Civlian Workforce | 5,075 | 31,287 | 67,742 | |
Military Workforce | 0 | 9 | 18 | |
Total Households | 3,252 | 22,434 | 48,412 | |
Family Households | 2,260 | 14,448 | 31,800 | |
Non-Family Households | 992 | 7,985 | 16,612 | |
Married Couple | 1,743 | 10,570 | 22,991 | |
Other Family | 517 | 3,878 | 8,809 | |
Married w/Child | 592 | 4,144 | 8,738 | |
Single Male w/Child | 40 | 312 | 870 | |
Single Female w/Child | 204 | 1,477 | 2,930 |
Population Change Last Two Decades - Plus Projection
2000 | % | 2010 | % | 2020 | % | 2030 | |
---|---|---|---|---|---|---|---|
New Jersey | 8,414,350 | +4 | 8,791,894 | +4 | 9,132,700 | +4 | 9,530,900 |
Camden County | 508,932 | +1 | 513,657 | 0 | 511,800 | +2 | 521,000 |
Gloucester County | 254,673 | +13 | 288,288 | +1 | 292,000 | +5 | 305,800 |
Salem County | 64,285 | +3 | 66,083 | -5 | 63,000 | -3 | 61,000 |
Pennsylvania | 12,281,054 | +3 | 12,702,379 | +4 | 13,230,170 | +4 | 13,759,594 |
Delaware County | 550,864 | +1 | 558,979 | +5 | 588,436 | +6 | 622,307 |
Philadelphia County | 1,517,550 | +1 | 1,526,006 | +8 | 1,653,729 | +6 | 1,753,054 |
Total Working Age Population:
Total Households:
Total Working Age Population:
Total Households:
Total Working Age Population:
Total Households: