Retail Space
Route 222 Bypass and Krocks Rd Wescosville, PA 18069
Route 222 Bypass and Krocks Rd Wescosville, PA 18069
Details & Description
Property Highlights
• Developed by The Goldenberg Group and TCH Development
• Developed by The Goldenberg Group and TCH Development
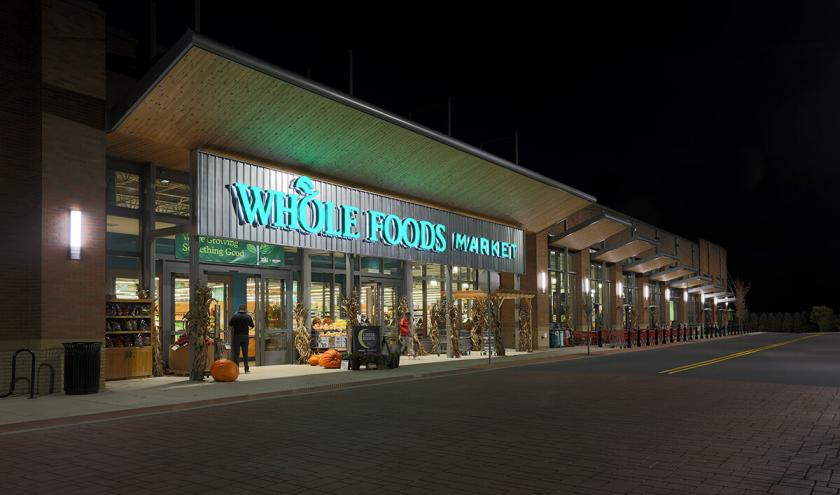
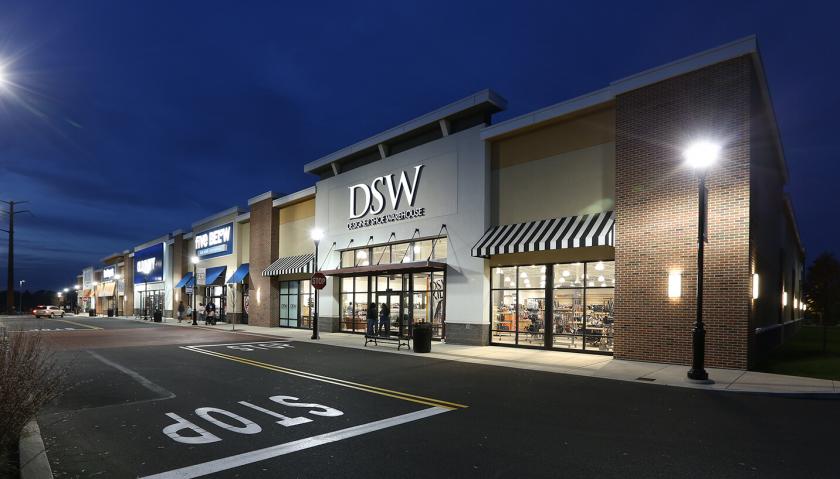
Additional Photos


Listing Agents

Glenn Marvin
O: 610-260-2674
M: 610-316-6047
gmarvin@metrocommercial.com
O: 610-260-2674
M: 610-316-6047
gmarvin@metrocommercial.com
While we strive to provide the most accurate information, all listing information, and demographic data, is provided by third-parties. As such, MyEListing will not be responsible for the accuracy of the information. It is strongly recommended that you verify all information with the listing agent, and any relevant agencies, prior to making any decisions.


