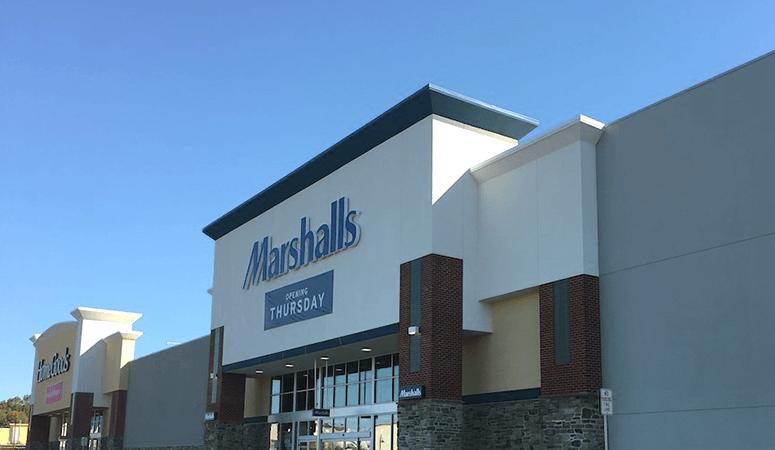
Retail Space
Fashion Center Blvd New Castle, DE 19720
Fashion Center Blvd New Castle, DE 19720

Details & Description
Property Highlights
• All phases of center now open enjoys diverse mix of restaurants, entertainment, fitness, and traditional retail.
• Delawares tax-free shopping attracts shoppers from Maryland, New Jersey, Pennsylvania and beyond.
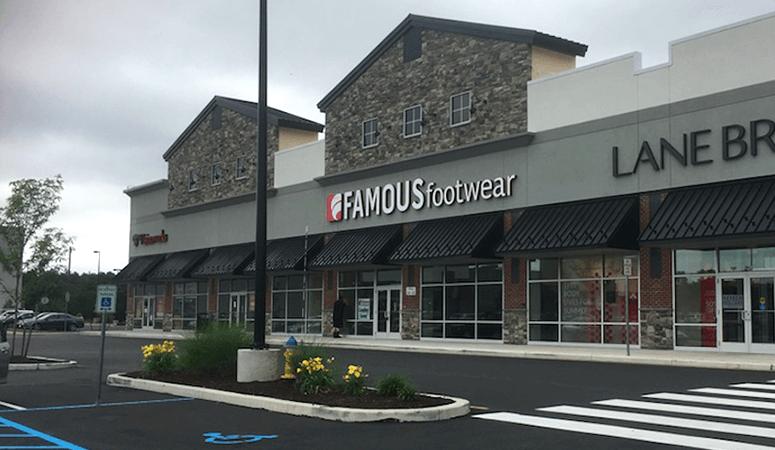
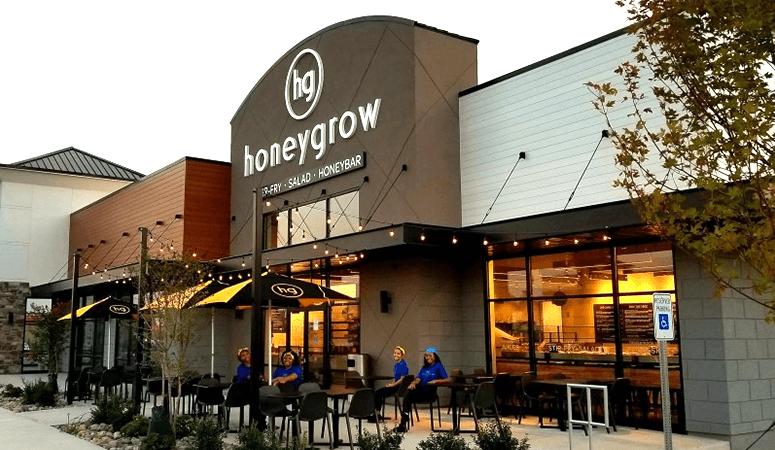
Additional Photos
Listing Agents

Andrew Shpigel
O: 215-282-0153
M: 215-470-8510
ashpigel@metrocommercial.com
O: 215-282-0153
M: 215-470-8510
ashpigel@metrocommercial.com
While we strive to provide the most accurate information, all listing information, and demographic data, is provided by third-parties. As such, MyEListing will not be responsible for the accuracy of the information. It is strongly recommended that you verify all information with the listing agent, and any relevant agencies, prior to making any decisions.


