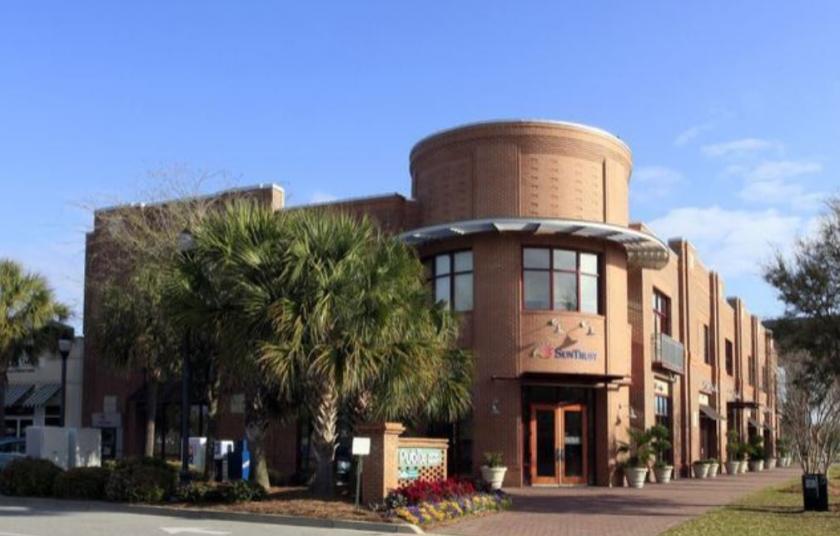
Office Space
162 Seven Farms Drive Charleston, SC 29492
162 Seven Farms Drive Charleston, SC 29492
Details & Description
Property Highlights
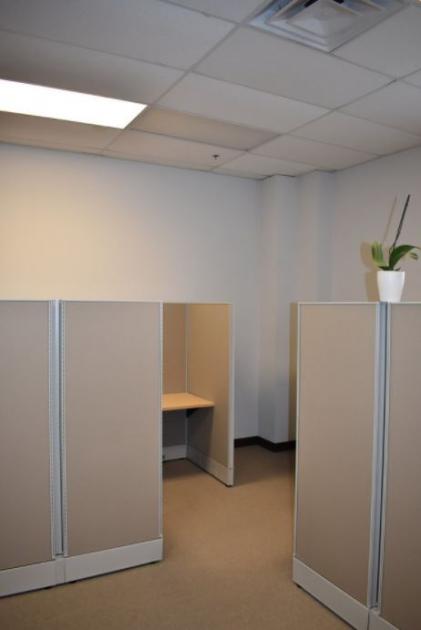
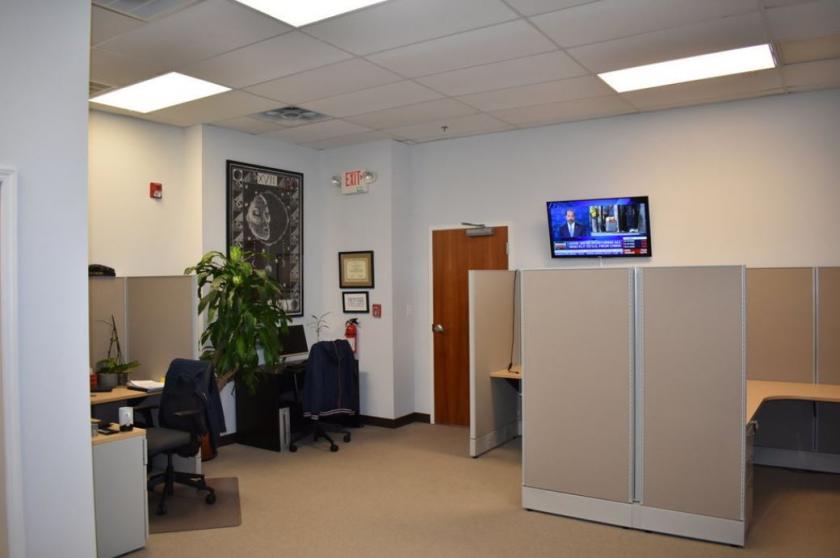
- • Short Term Opportunity for Lease
- • Cubicles covey with space
- • Located in the heart of beautiful Daniel Island
- • Walking distance to everything
- • Easy Access to I -526
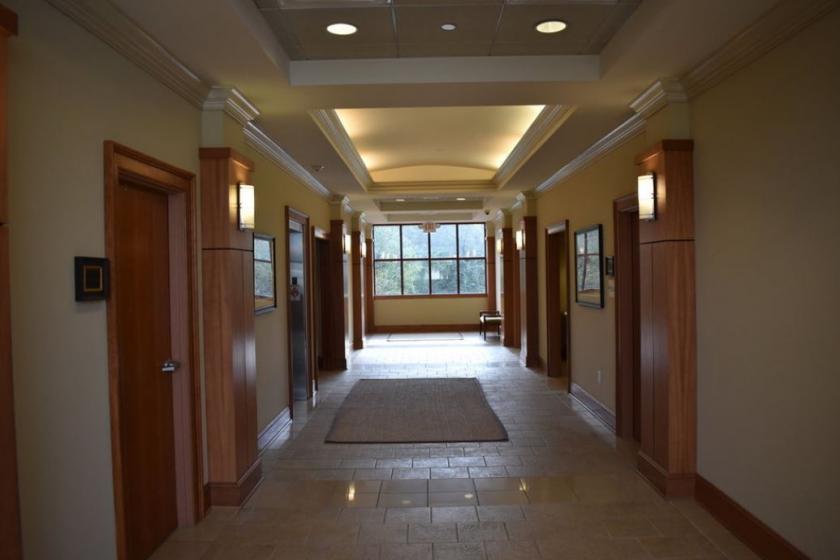
Additional Photos
Listing Agents

Weston Bradley
O: 843-203-1060
M: 757-373-3570
wbradley@lee-associates.com
O: 843-203-1060
M: 757-373-3570
wbradley@lee-associates.com
While we strive to provide the most accurate information, all listing information, and demographic data, is provided by third-parties. As such, MyEListing will not be responsible for the accuracy of the information. It is strongly recommended that you verify all information with the listing agent, and any relevant agencies, prior to making any decisions.


