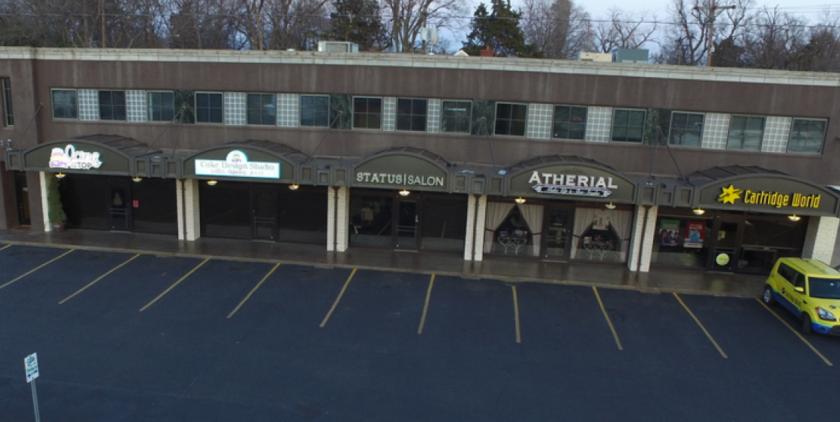
Office Space
3303 East 13th Street Tulsa, OK 74112
3303 East 13th Street Tulsa, OK 74112
Details & Description
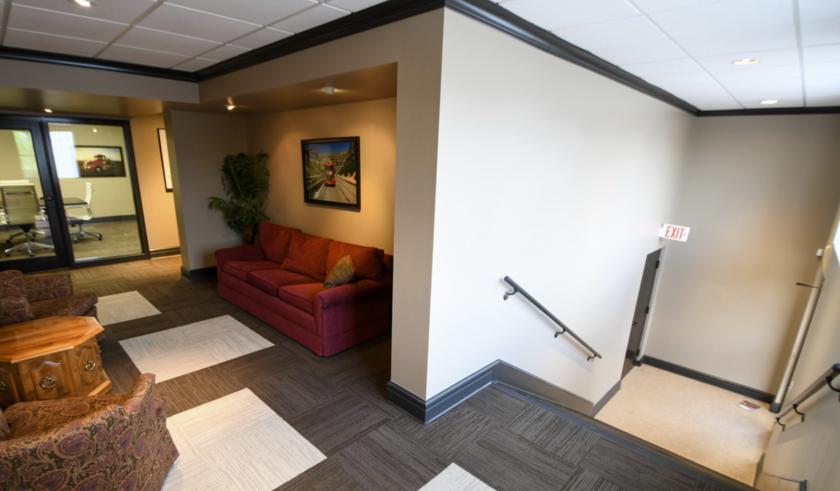
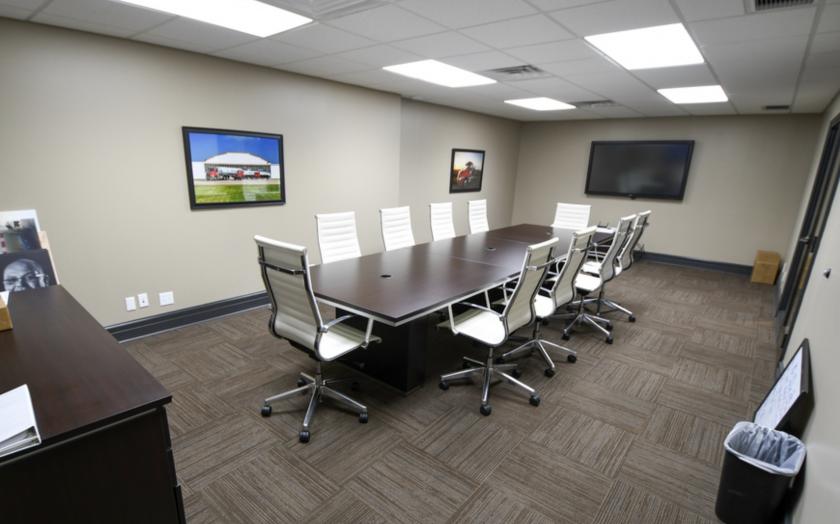
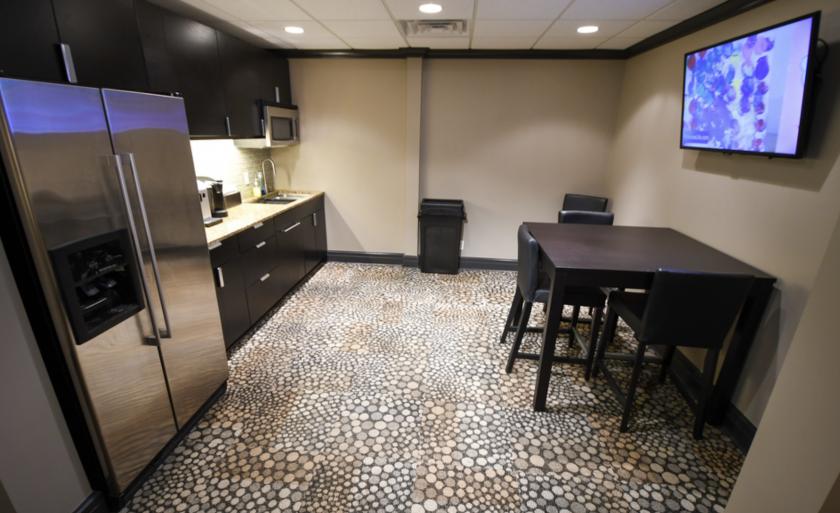
Additional Photos
Listing Agents

Kayla Billingsly
O: 918-810-7921
kbillingsly@mcgrawcp.com
O: 918-810-7921
kbillingsly@mcgrawcp.com
While we strive to provide the most accurate information, all listing information, and demographic data, is provided by third-parties. As such, MyEListing will not be responsible for the accuracy of the information. It is strongly recommended that you verify all information with the listing agent, and any relevant agencies, prior to making any decisions.


