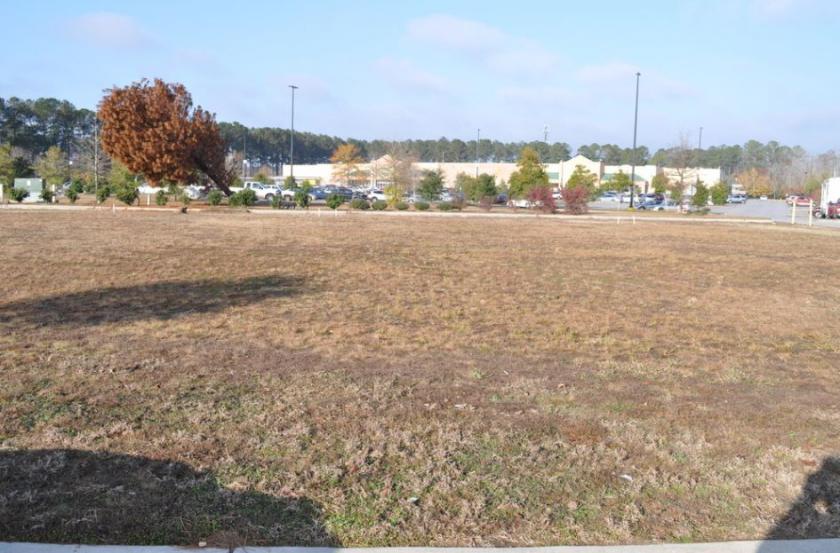
Commercial Land
386 D Mark Cummings Road Hardeeville, SC 29927
386 D Mark Cummings Road Hardeeville, SC 29927
Details & Description
Property Highlights
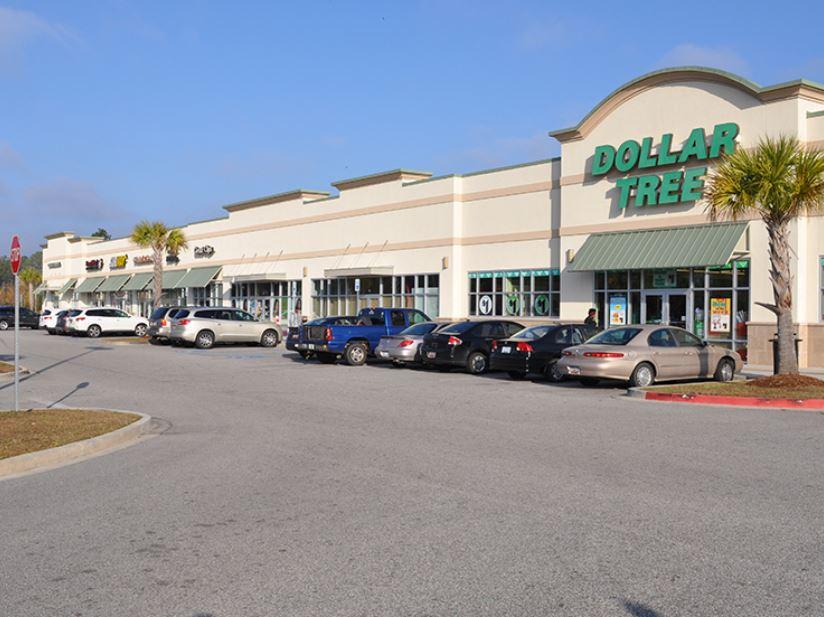
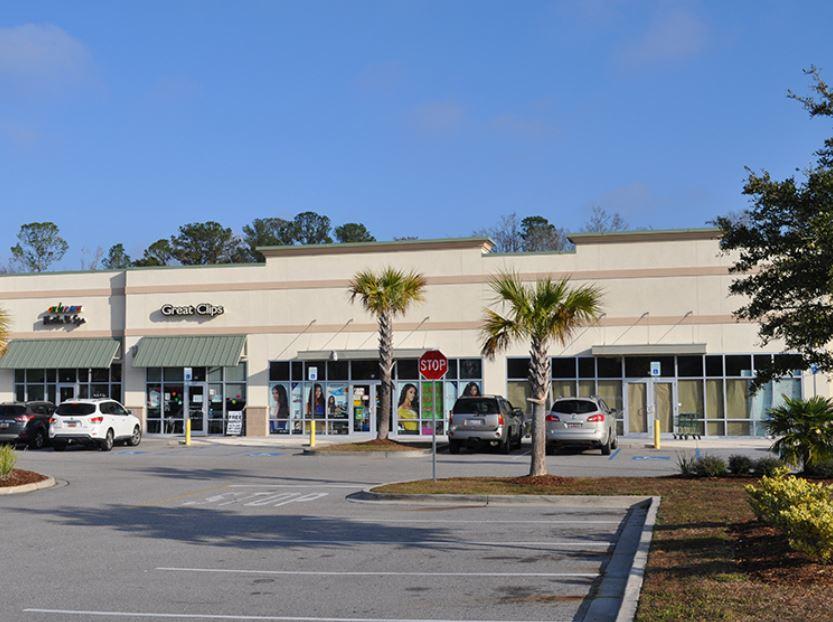
• Co-Tenants Dollar Tree, T-Mobile, Great Clips, Glamour Beauty Supply, Subway, Coastal Bedding Outlet
• University of South Carolina Beaufort campus is located directly across Hwy 278
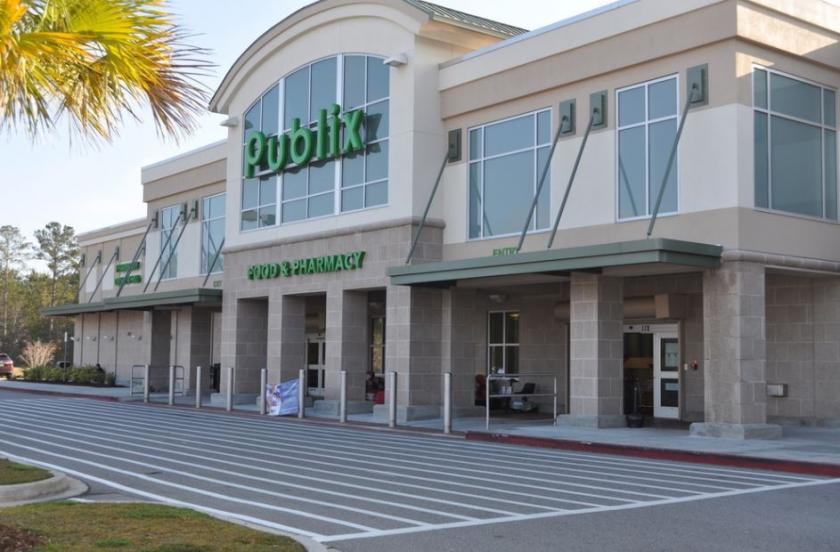
Additional Photos
Listing Agents

Justin Ross
O: 843-203-1055
M: 301-538-3540
jross@lee-associates.com
O: 843-203-1055
M: 301-538-3540
jross@lee-associates.com
While we strive to provide the most accurate information, all listing information, and demographic data, is provided by third-parties. As such, MyEListing will not be responsible for the accuracy of the information. It is strongly recommended that you verify all information with the listing agent, and any relevant agencies, prior to making any decisions.


