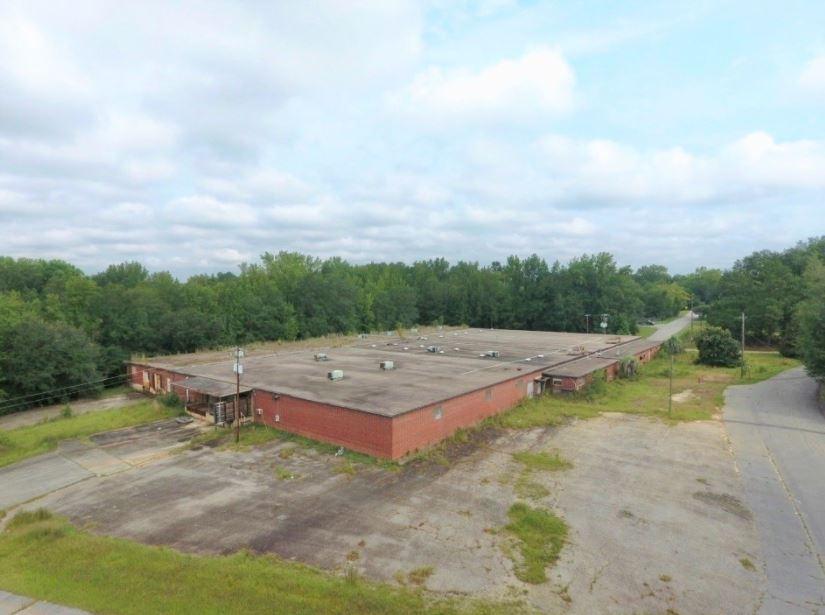
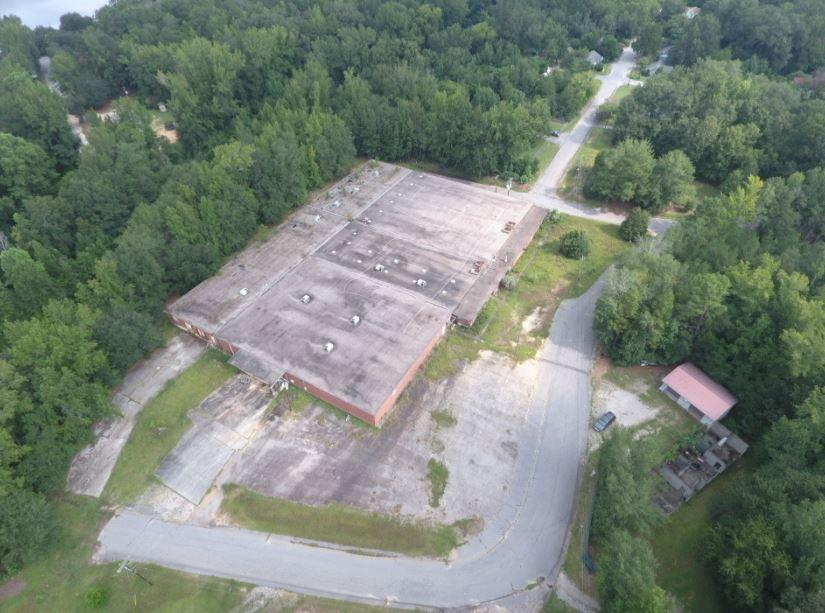
1-Mile | 3-Miles | 5-Miles | ||
---|---|---|---|---|
Total Population | 344 | 2,866 | 7,432 | |
Population Median Age | 45 | 43 | 41 | |
Population by Age | 0-9 Yrs | 26 (7%) | 296 (10%) | 822 (11%) |
10-19 Yrs | 27 (7%) | 269 (9%) | 816 (10%) | |
20-29 Yrs | 50 (14%) | 354 (12%) | 879 (11%) | |
30-39 Yrs | 39 (11%) | 338 (11%) | 879 (11%) | |
40-49 Yrs | 31 (9%) | 335 (11%) | 944 (12%) | |
50-59 Yrs | 77 (22%) | 575 (20%) | 1378 (18%) | |
60-69 Yrs | 41 (11%) | 336 (11%) | 885 (11%) | |
70+ Yrs | 53 (15%) | 362 (12%) | 829 (11%) | |
Median HH Income | $35,407 | $40,021 | $38,518 | |
Total Household Income | < 24K | 55 (35%) | 385 (30%) | 982 (31%) |
25-49K | 42 (26%) | 363 (29%) | 913 (28%) | |
50-74K | 30 (19%) | 245 (19%) | 579 (18%) | |
75-99K | 15 (9%) | 104 (8%) | 342 (10%) | |
100-199K | 9 (5%) | 96 (7%) | 255 (8%) | |
200K+ | 6 (3%) | 58 (4%) | 89 (2%) | |
Highest Education Level | No Diploma | 52 | 418 | 1108 |
Diploma or GED | 95 | 863 | 2215 | |
Some College | 70 | 471 | 1061 | |
Assoc. Degree | 29 | 197 | 456 | |
Bachelors Degree | 12 | 128 | 396 | |
Higher Degree | 5 | 43 | 127 | |
Total Housing Units | 187 | 1,509 | 3,756 | |
--Owner-Occupied | 118 | 905 | 2,372 | |
--Renter-Occupied | 38 | 346 | 788 | |
Owner-Occupied Values | < 100K | 86 | 635 | 1613 |
100-199K | 17 | 173 | 519 | |
200-299K | 11 | 83 | 197 | |
300-399K | 3 | 11 | 30 | |
400-499K | 0 | 0 | 4 | |
500K+ | 1 | 3 | 8 | |
Total Working Age Population | 300 | 2,405 | 6,108 | |
In Work Force | 154 | 1,309 | 3,381 | |
Not In Work Force | 146 | 1,095 | 2,727 | |
Workforce Employed | 147 | 1,238 | 3,164 | |
Workforce Unemployed | 7 | 71 | 216 | |
Civlian Workforce | 154 | 1,309 | 3,380 | |
Military Workforce | 0 | 0 | 1 | |
Total Households | 156 | 1,251 | 3,159 | |
Family Households | 91 | 743 | 1,893 | |
Non-Family Households | 66 | 508 | 1,267 | |
Married Couple | 62 | 512 | 1,288 | |
Other Family | 29 | 231 | 605 | |
Married w/Child | 9 | 127 | 389 | |
Single Male w/Child | 10 | 34 | 84 | |
Single Female w/Child | 6 | 87 | 227 |
Population Change Last Two Decades - Plus Projection
2000 | % | 2010 | % | 2020 | % | 2030 | |
---|---|---|---|---|---|---|---|
South Carolina | 4,012,012 | +15 | 4,625,364 | +9 | 5,020,400 | +9 | 5,488,460 |
Aiken County | 142,552 | +12 | 160,099 | +11 | 177,510 | +11 | 196,500 |
Calhoun County | 15,185 | 0 | 15,175 | +10 | 16,660 | +8 | 17,980 |
Lexington County | 216,014 | +21 | 262,391 | +12 | 294,510 | +13 | 333,180 |
Orangeburg County | 91,582 | +1 | 92,501 | +4 | 96,400 | +4 | 100,700 |
Richland County | 320,677 | +20 | 384,504 | +3 | 395,920 | +8 | 425,960 |
Total Working Age Population:
Total Households:
Total Working Age Population:
Total Households:
Total Working Age Population:
Total Households: