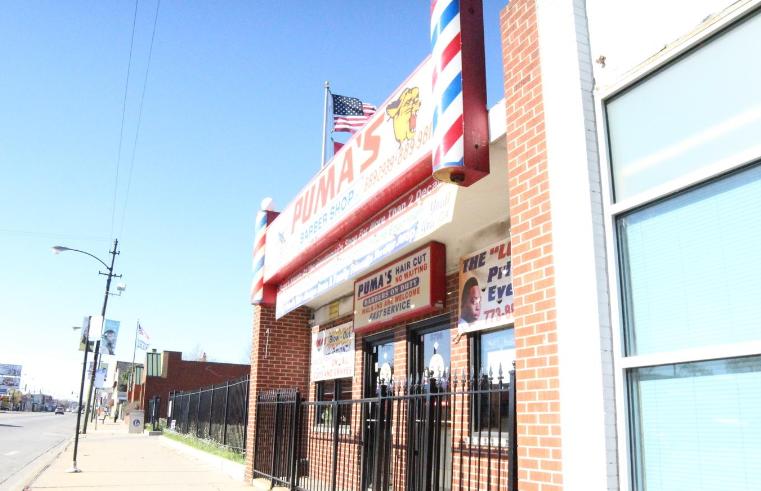
1-Mile | 3-Miles | 5-Miles | ||
---|---|---|---|---|
Total Population | 46,642 | 418,907 | 1,018,829 | |
Population Median Age | 37 | 37 | 36 | |
Population by Age | 0-9 Yrs | 6381 (13%) | 56245 (13%) | 130968 (12%) |
10-19 Yrs | 6257 (13%) | 56705 (13%) | 126225 (12%) | |
20-29 Yrs | 6864 (14%) | 59026 (14%) | 158241 (15%) | |
30-39 Yrs | 6864 (14%) | 61396 (14%) | 171544 (16%) | |
40-49 Yrs | 6118 (13%) | 56946 (13%) | 138783 (13%) | |
50-59 Yrs | 5412 (11%) | 52499 (12%) | 120968 (11%) | |
60-69 Yrs | 5328 (11%) | 43598 (10%) | 95927 (9%) | |
70+ Yrs | 3418 (7%) | 32491 (7%) | 76174 (7%) | |
Median HH Income | $46,508 | $52,215 | $59,099 | |
Total Household Income | < 24K | 4073 (27%) | 36471 (25%) | 79164 (22%) |
25-49K | 3796 (25%) | 32035 (22%) | 75677 (21%) | |
50-74K | 2351 (15%) | 22339 (15%) | 58156 (16%) | |
75-99K | 1615 (10%) | 16094 (11%) | 43791 (12%) | |
100-199K | 2270 (15%) | 26253 (18%) | 76151 (21%) | |
200K+ | 762 (5%) | 8574 (6%) | 26279 (7%) | |
Highest Education Level | No Diploma | 6267 | 57161 | 123422 |
Diploma or GED | 9657 | 77595 | 181551 | |
Some College | 6750 | 52435 | 122782 | |
Assoc. Degree | 2091 | 18158 | 44961 | |
Bachelors Degree | 3489 | 41472 | 136229 | |
Higher Degree | 2250 | 30497 | 83663 | |
Total Housing Units | 17,252 | 158,829 | 402,582 | |
--Owner-Occupied | 8,118 | 71,318 | 178,061 | |
--Renter-Occupied | 6,749 | 70,447 | 181,158 | |
Owner-Occupied Values | < 100K | 848 | 6235 | 12405 |
100-199K | 2550 | 16282 | 39289 | |
200-299K | 2830 | 22871 | 53452 | |
300-399K | 1075 | 13721 | 35436 | |
400-499K | 359 | 4823 | 14916 | |
500K+ | 455 | 7385 | 22563 | |
Total Working Age Population | 36,575 | 328,425 | 810,429 | |
In Work Force | 22,882 | 215,095 | 548,728 | |
Not In Work Force | 13,693 | 113,330 | 261,701 | |
Workforce Employed | 20,590 | 198,223 | 513,749 | |
Workforce Unemployed | 2,292 | 16,712 | 34,616 | |
Civlian Workforce | 22,882 | 214,935 | 548,365 | |
Military Workforce | 0 | 160 | 363 | |
Total Households | 14,867 | 141,765 | 359,219 | |
Family Households | 10,488 | 93,108 | 225,298 | |
Non-Family Households | 4,379 | 48,657 | 133,921 | |
Married Couple | 5,449 | 54,912 | 140,756 | |
Other Family | 5,039 | 38,196 | 84,542 | |
Married w/Child | 2,166 | 24,101 | 61,667 | |
Single Male w/Child | 465 | 3,949 | 8,810 | |
Single Female w/Child | 1,604 | 13,247 | 29,577 |
Population Change Last Two Decades - Plus Projection
2000 | % | 2010 | % | 2020 | % | 2030 | |
---|---|---|---|---|---|---|---|
Illinois | 12,419,293 | +3 | 12,830,632 | +12 | 14,316,487 | +6 | 15,138,849 |
Cook County | 5,376,741 | -3 | 5,194,675 | +10 | 5,707,832 | +5 | 5,990,243 |
Total Working Age Population:
Total Households:
Total Working Age Population:
Total Households:
Total Working Age Population:
Total Households: