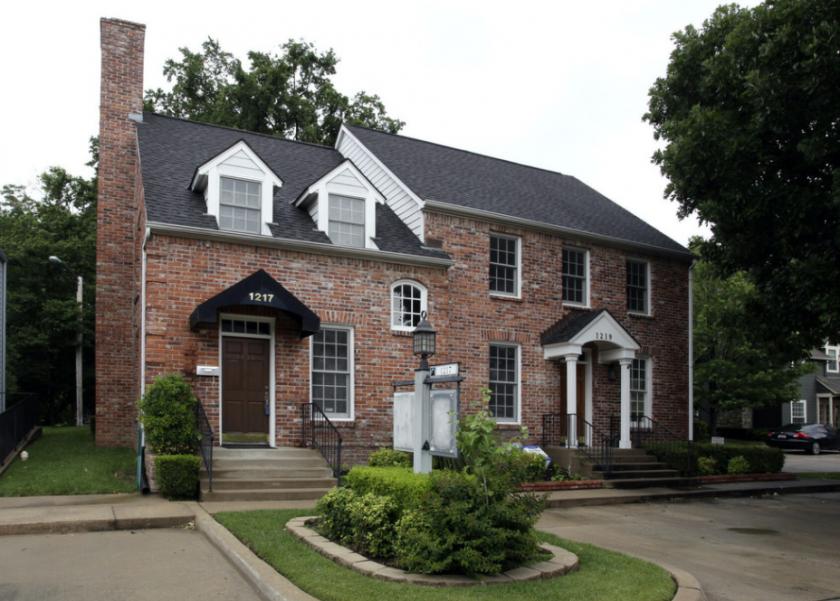
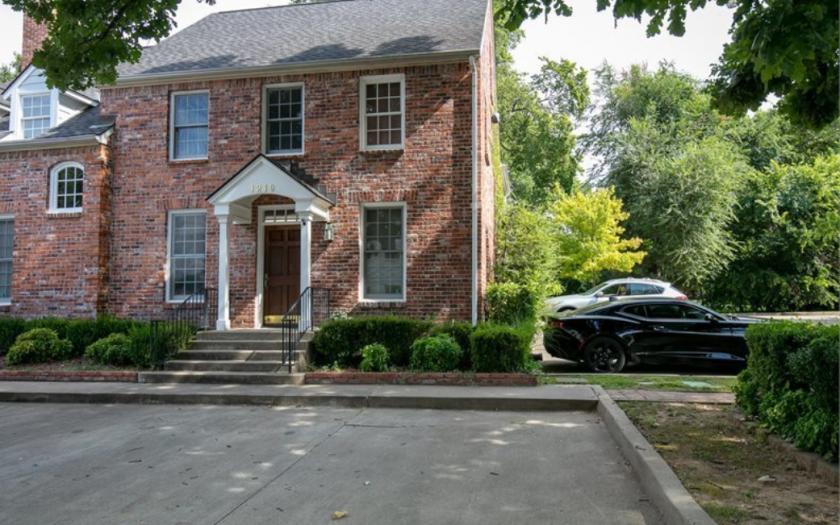
Office Space
1217 East 33rd Street Tulsa, OK 74105
1217 East 33rd Street Tulsa, OK 74105
Details & Description
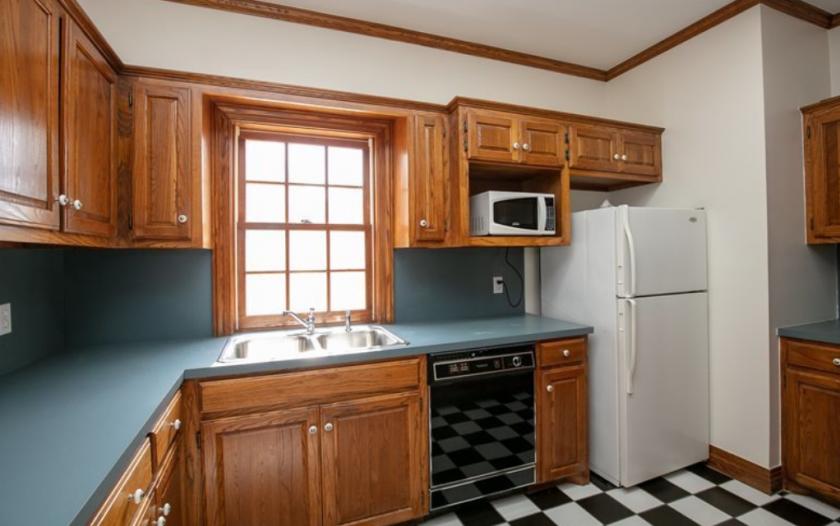
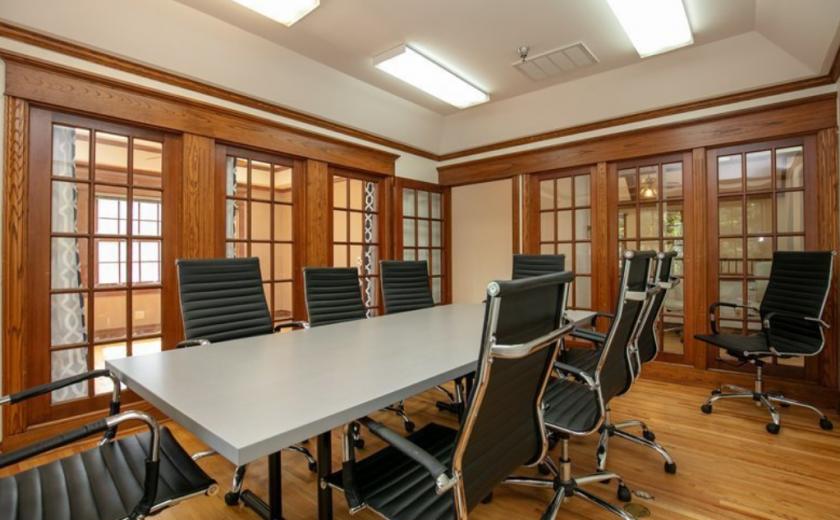
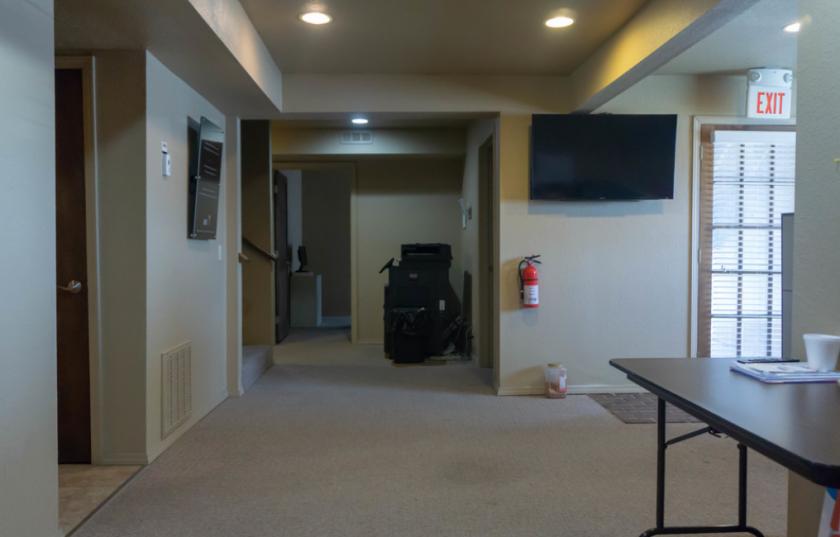
Additional Photos
Listing Agents

Dick Alaback
O: 918-724-8955
rjalaback@mcgrawcp.com
O: 918-724-8955
rjalaback@mcgrawcp.com
While we strive to provide the most accurate information, all listing information, and demographic data, is provided by third-parties. As such, MyEListing will not be responsible for the accuracy of the information. It is strongly recommended that you verify all information with the listing agent, and any relevant agencies, prior to making any decisions.


