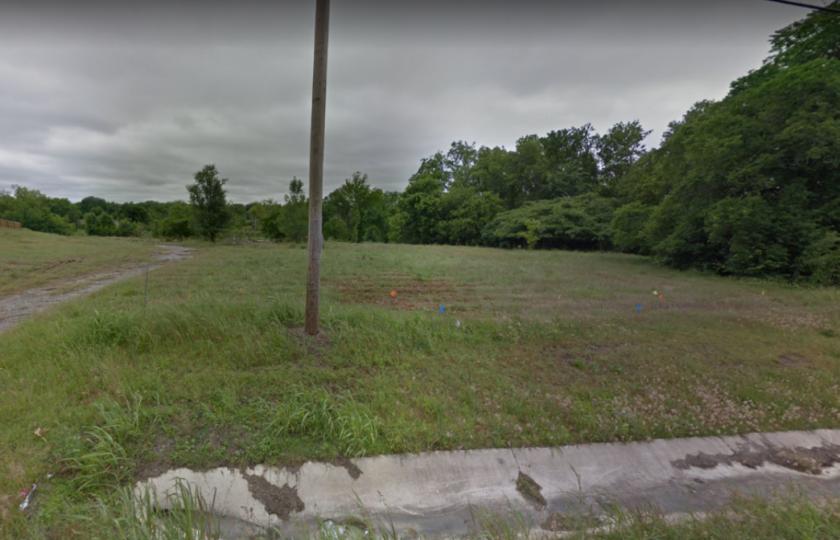
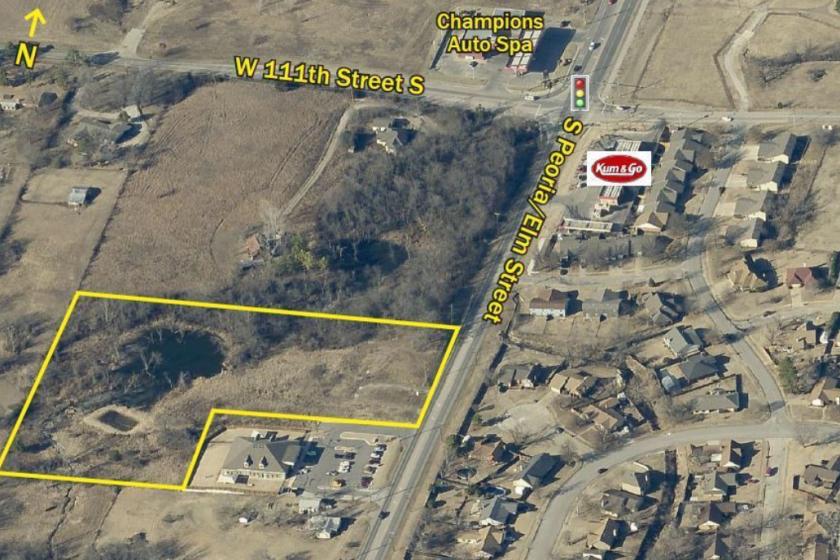
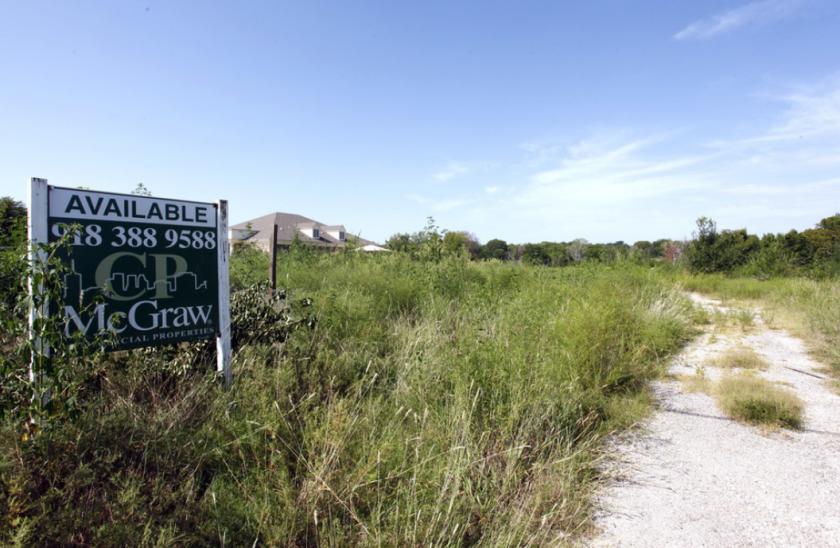
1-Mile | 3-Miles | 5-Miles | ||
---|---|---|---|---|
Total Population | 3,658 | 36,842 | 105,506 | |
Population Median Age | 34 | 35 | 37 | |
Population by Age | 0-9 Yrs | 575 (15%) | 5619 (15%) | 14643 (13%) |
10-19 Yrs | 719 (19%) | 6102 (16%) | 15653 (14%) | |
20-29 Yrs | 329 (8%) | 4387 (11%) | 14394 (13%) | |
30-39 Yrs | 517 (14%) | 5530 (15%) | 14314 (13%) | |
40-49 Yrs | 631 (17%) | 5266 (14%) | 13825 (13%) | |
50-59 Yrs | 402 (10%) | 4178 (11%) | 12299 (11%) | |
60-69 Yrs | 265 (7%) | 3029 (8%) | 10812 (10%) | |
70+ Yrs | 221 (6%) | 2731 (7%) | 9567 (9%) | |
Median HH Income | $90,629 | $82,441 | $71,045 | |
Total Household Income | < 24K | 89 (7%) | 1512 (11%) | 6266 (15%) |
25-49K | 249 (20%) | 2581 (19%) | 8588 (21%) | |
50-74K | 144 (12%) | 1886 (14%) | 6134 (15%) | |
75-99K | 183 (15%) | 1818 (13%) | 4796 (11%) | |
100-199K | 417 (35%) | 3705 (28%) | 9551 (23%) | |
200K+ | 110 (9%) | 1538 (11%) | 4857 (12%) | |
Highest Education Level | No Diploma | 199 | 1727 | 5186 |
Diploma or GED | 407 | 4345 | 12581 | |
Some College | 469 | 5040 | 14129 | |
Assoc. Degree | 280 | 2198 | 6039 | |
Bachelors Degree | 593 | 6641 | 19551 | |
Higher Degree | 280 | 3213 | 10441 | |
Total Housing Units | 1,254 | 14,150 | 44,037 | |
--Owner-Occupied | 974 | 8,857 | 23,965 | |
--Renter-Occupied | 217 | 4,182 | 16,227 | |
Owner-Occupied Values | < 100K | 33 | 764 | 1996 |
100-199K | 516 | 3375 | 7793 | |
200-299K | 302 | 2455 | 6323 | |
300-399K | 59 | 1019 | 3451 | |
400-499K | 7 | 400 | 1683 | |
500K+ | 57 | 844 | 2720 | |
Total Working Age Population | 2,642 | 27,324 | 81,684 | |
In Work Force | 1,898 | 19,128 | 55,393 | |
Not In Work Force | 744 | 8,196 | 26,291 | |
Workforce Employed | 1,826 | 18,227 | 53,020 | |
Workforce Unemployed | 72 | 882 | 2,313 | |
Civlian Workforce | 1,898 | 19,109 | 55,334 | |
Military Workforce | 0 | 19 | 59 | |
Total Households | 1,191 | 13,039 | 40,192 | |
Family Households | 949 | 9,608 | 26,901 | |
Non-Family Households | 243 | 3,431 | 13,292 | |
Married Couple | 784 | 7,545 | 21,221 | |
Other Family | 165 | 2,063 | 5,679 | |
Married w/Child | 467 | 3,874 | 9,571 | |
Single Male w/Child | 31 | 471 | 1,037 | |
Single Female w/Child | 78 | 743 | 2,262 |
Population Change Last Two Decades - Plus Projection
2000 | % | 2010 | % | 2020 | % | 2030 | |
---|---|---|---|---|---|---|---|
Oklahoma | 3,450,654 | +9 | 3,751,351 | +7 | 4,024,202 | +7 | 4,302,501 |
Creek County | 67,367 | +4 | 69,967 | +8 | 75,823 | +8 | 81,992 |
Tulsa County | 563,299 | +7 | 603,403 | +8 | 652,183 | +8 | 703,461 |
Total Working Age Population:
Total Households:
Total Working Age Population:
Total Households:
Total Working Age Population:
Total Households: