Retail Space
5900 Chalkville Mountain Road Birmingham, AL 35235
5900 Chalkville Mountain Road Birmingham, AL 35235

Details & Description
Property Highlights
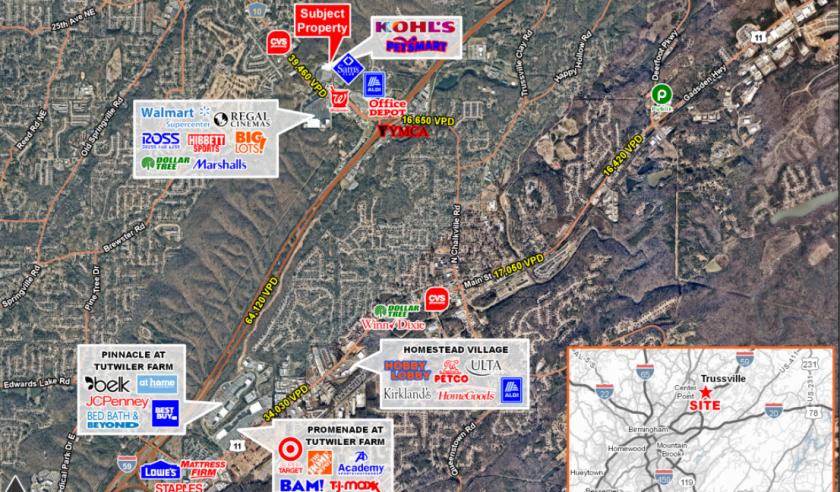
• Located on Chalkville Mountain Road in one of Trussvilles primary shopping corridors
• Great co-tenant that generates high volume of daily traffic
Listing Agents

Kathy Dennis
O: 205-870-5655
kathy.dennis@tscg.com
O: 205-870-5655
kathy.dennis@tscg.com
While we strive to provide the most accurate information, all listing information, and demographic data, is provided by third-parties. As such, MyEListing will not be responsible for the accuracy of the information. It is strongly recommended that you verify all information with the listing agent, and any relevant agencies, prior to making any decisions.