Office Space
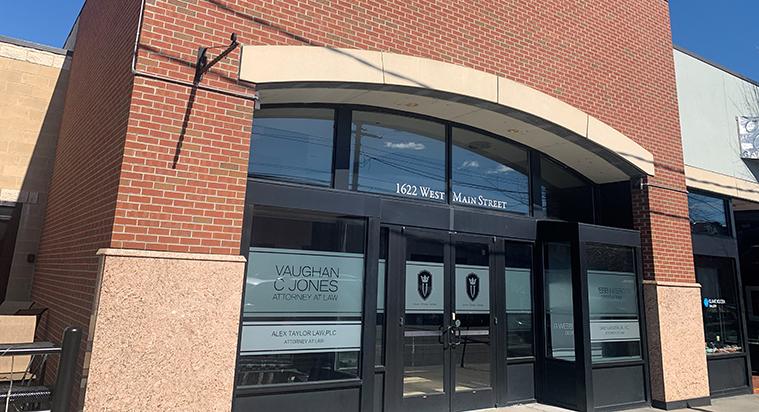
1622 West Main Street Richmond, VA 23220
1622 West Main Street Richmond, VA 23220
Details & Description
Property Highlights
- • Rare Owner Occupant Opportunity
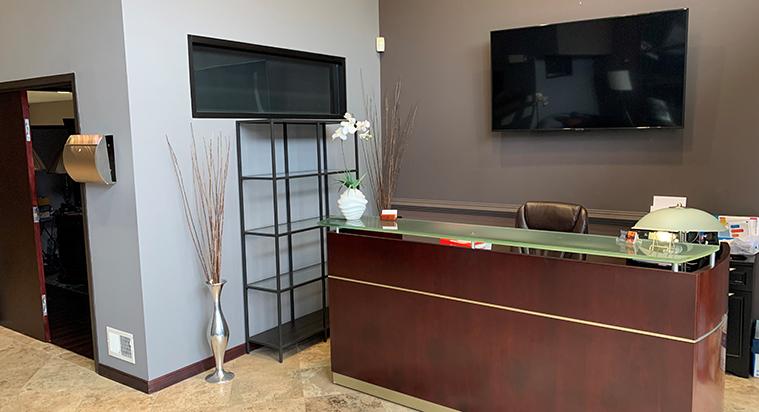
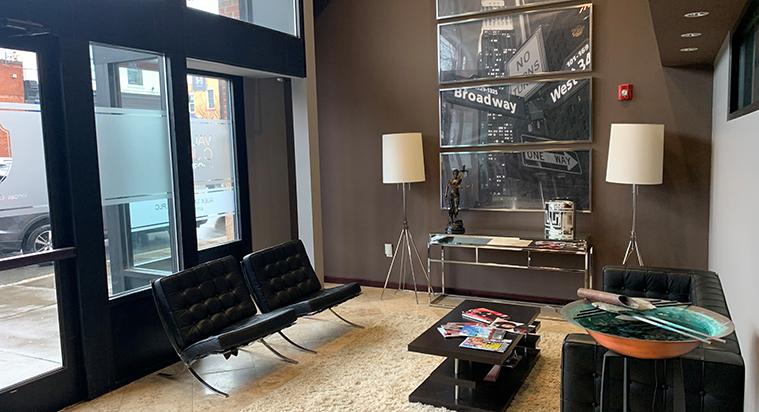
- • Combination of open space and private offices
- • Class A interior finishes
- • Building signage available
- • On-site parking and street parking
- • Numerous amenities within walking distance
Listing Agents

Tucker Nash Warren
O: 804-793-0064
twarren@commonwealthcommercial.com
O: 804-793-0064
twarren@commonwealthcommercial.com

Jamie Galanti
O: 804-433-1825
jgalanti@commonwealthcommercial.com
O: 804-433-1825
jgalanti@commonwealthcommercial.com
While we strive to provide the most accurate information, all listing information, and demographic data, is provided by third-parties. As such, MyEListing will not be responsible for the accuracy of the information. It is strongly recommended that you verify all information with the listing agent, and any relevant agencies, prior to making any decisions.