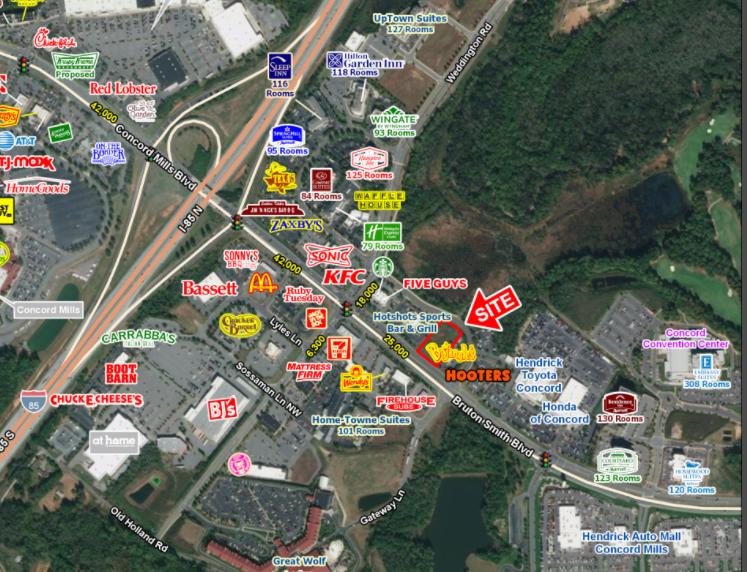
1-Mile | 3-Miles | 5-Miles | ||
---|---|---|---|---|
Total Population | 1,849 | 35,917 | 127,244 | |
Population Median Age | 36 | 35 | 35 | |
Population by Age | 0-9 Yrs | 233 (12%) | 4293 (11%) | 15048 (11%) |
10-19 Yrs | 249 (13%) | 5227 (14%) | 19720 (15%) | |
20-29 Yrs | 277 (14%) | 5629 (15%) | 21298 (16%) | |
30-39 Yrs | 259 (14%) | 5534 (15%) | 18429 (14%) | |
40-49 Yrs | 316 (17%) | 5994 (16%) | 19637 (15%) | |
50-59 Yrs | 230 (12%) | 4229 (11%) | 15439 (12%) | |
60-69 Yrs | 168 (9%) | 2970 (8%) | 10051 (7%) | |
70+ Yrs | 117 (6%) | 2041 (5%) | 7622 (5%) | |
Median HH Income | $56,928 | $70,004 | $73,386 | |
Total Household Income | < 24K | 120 (14%) | 1772 (12%) | 5899 (12%) |
25-49K | 210 (25%) | 2877 (20%) | 9221 (19%) | |
50-74K | 183 (22%) | 2690 (19%) | 8594 (18%) | |
75-99K | 152 (18%) | 2132 (15%) | 7130 (15%) | |
100-199K | 135 (16%) | 3460 (24%) | 12002 (25%) | |
200K+ | 10 (1%) | 927 (6%) | 3627 (7%) | |
Highest Education Level | No Diploma | 64 | 987 | 4031 |
Diploma or GED | 241 | 3377 | 12071 | |
Some College | 371 | 5666 | 17028 | |
Assoc. Degree | 81 | 2248 | 7818 | |
Bachelors Degree | 322 | 7659 | 25544 | |
Higher Degree | 171 | 3900 | 14142 | |
Total Housing Units | 856 | 15,015 | 50,342 | |
--Owner-Occupied | 436 | 8,358 | 29,350 | |
--Renter-Occupied | 373 | 5,501 | 17,123 | |
Owner-Occupied Values | < 100K | 80 | 501 | 1510 |
100-199K | 152 | 2719 | 9829 | |
200-299K | 169 | 3057 | 10565 | |
300-399K | 26 | 1287 | 4733 | |
400-499K | 5 | 506 | 1641 | |
500K+ | 4 | 288 | 1072 | |
Total Working Age Population | 1,464 | 28,346 | 101,082 | |
In Work Force | 1,054 | 20,375 | 70,837 | |
Not In Work Force | 410 | 7,971 | 30,245 | |
Workforce Employed | 985 | 19,442 | 67,755 | |
Workforce Unemployed | 59 | 839 | 2,924 | |
Civlian Workforce | 1,044 | 20,281 | 70,679 | |
Military Workforce | 10 | 94 | 158 | |
Total Households | 809 | 13,859 | 46,473 | |
Family Households | 399 | 8,460 | 29,883 | |
Non-Family Households | 410 | 5,399 | 16,590 | |
Married Couple | 249 | 6,538 | 23,604 | |
Other Family | 150 | 1,923 | 6,279 | |
Married w/Child | 142 | 3,321 | 11,480 | |
Single Male w/Child | 2 | 187 | 936 | |
Single Female w/Child | 98 | 1,021 | 2,727 |
Population Change Last Two Decades - Plus Projection
2000 | % | 2010 | % | 2020 | % | 2030 | |
---|---|---|---|---|---|---|---|
North Carolina | 8,049,313 | +18 | 9,535,483 | +11 | 10,630,691 | +11 | 11,836,070 |
Cabarrus County | 131,063 | +36 | 178,011 | +22 | 216,608 | +20 | 259,075 |
Mecklenburg County | 695,454 | +32 | 919,628 | +23 | 1,131,342 | +19 | 1,348,822 |
Total Working Age Population:
Total Households:
Total Working Age Population:
Total Households:
Total Working Age Population:
Total Households: