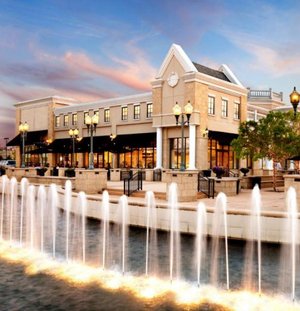
1-Mile | 3-Miles | 5-Miles | ||
---|---|---|---|---|
Total Population | 5,566 | 77,991 | 181,634 | |
Population Median Age | 33 | 33 | 34 | |
Population by Age | 0-9 Yrs | 562 (10%) | 7967 (10%) | 21726 (11%) |
10-19 Yrs | 237 (4%) | 11048 (14%) | 25714 (14%) | |
20-29 Yrs | 2194 (39%) | 20647 (26%) | 35317 (19%) | |
30-39 Yrs | 1181 (21%) | 12163 (15%) | 28844 (15%) | |
40-49 Yrs | 445 (7%) | 9870 (12%) | 25201 (13%) | |
50-59 Yrs | 283 (5%) | 8223 (10%) | 21463 (11%) | |
60-69 Yrs | 358 (6%) | 4801 (6%) | 13898 (7%) | |
70+ Yrs | 306 (5%) | 3272 (4%) | 9473 (5%) | |
Median HH Income | $50,813 | $53,082 | $55,015 | |
Total Household Income | < 24K | 566 (22%) | 5856 (19%) | 12179 (17%) |
25-49K | 683 (26%) | 8528 (27%) | 18881 (27%) | |
50-74K | 631 (24%) | 6157 (20%) | 14213 (20%) | |
75-99K | 276 (10%) | 3993 (13%) | 9598 (13%) | |
100-199K | 344 (13%) | 5092 (16%) | 12163 (17%) | |
200K+ | 57 (2%) | 970 (3%) | 2232 (3%) | |
Highest Education Level | No Diploma | 111 | 3858 | 12611 |
Diploma or GED | 408 | 6741 | 18977 | |
Some College | 621 | 11351 | 28438 | |
Assoc. Degree | 284 | 5258 | 12207 | |
Bachelors Degree | 1269 | 13581 | 29399 | |
Higher Degree | 891 | 7063 | 14798 | |
Total Housing Units | 2,953 | 33,437 | 74,767 | |
--Owner-Occupied | 359 | 11,867 | 35,128 | |
--Renter-Occupied | 2,199 | 18,728 | 34,139 | |
Owner-Occupied Values | < 100K | 25 | 1175 | 4474 |
100-199K | 198 | 6183 | 17254 | |
200-299K | 134 | 3123 | 9713 | |
300-399K | 1 | 855 | 2481 | |
400-499K | 0 | 323 | 665 | |
500K+ | 0 | 209 | 541 | |
Total Working Age Population | 4,882 | 65,107 | 145,815 | |
In Work Force | 3,383 | 45,498 | 102,014 | |
Not In Work Force | 1,499 | 19,608 | 43,801 | |
Workforce Employed | 3,212 | 43,425 | 97,115 | |
Workforce Unemployed | 172 | 1,963 | 4,726 | |
Civlian Workforce | 3,383 | 45,388 | 101,841 | |
Military Workforce | 0 | 111 | 173 | |
Total Households | 2,558 | 30,595 | 69,267 | |
Family Households | 1,013 | 15,325 | 39,899 | |
Non-Family Households | 1,544 | 15,270 | 29,368 | |
Married Couple | 855 | 10,642 | 26,931 | |
Other Family | 158 | 4,682 | 12,968 | |
Married w/Child | 330 | 4,297 | 11,600 | |
Single Male w/Child | 10 | 523 | 1,601 | |
Single Female w/Child | 35 | 1,793 | 5,446 |
Population Change Last Two Decades - Plus Projection
2000 | % | 2010 | % | 2020 | % | 2030 | |
---|---|---|---|---|---|---|---|
North Carolina | 8,049,313 | +18 | 9,535,483 | +11 | 10,630,691 | +11 | 11,836,070 |
Cabarrus County | 131,063 | +36 | 178,011 | +22 | 216,608 | +20 | 259,075 |
Mecklenburg County | 695,454 | +32 | 919,628 | +23 | 1,131,342 | +19 | 1,348,822 |
Total Working Age Population:
Total Households:
Total Working Age Population:
Total Households:
Total Working Age Population:
Total Households: