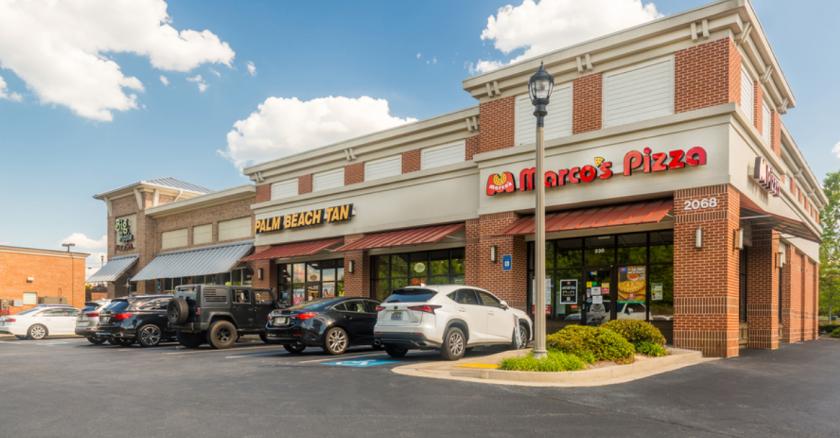
Retail Space
2060 Eagle Drive Woodstock, GA 30189
2060 Eagle Drive Woodstock, GA 30189
Details & Description
Property Highlights
- • Available 1,095 SF
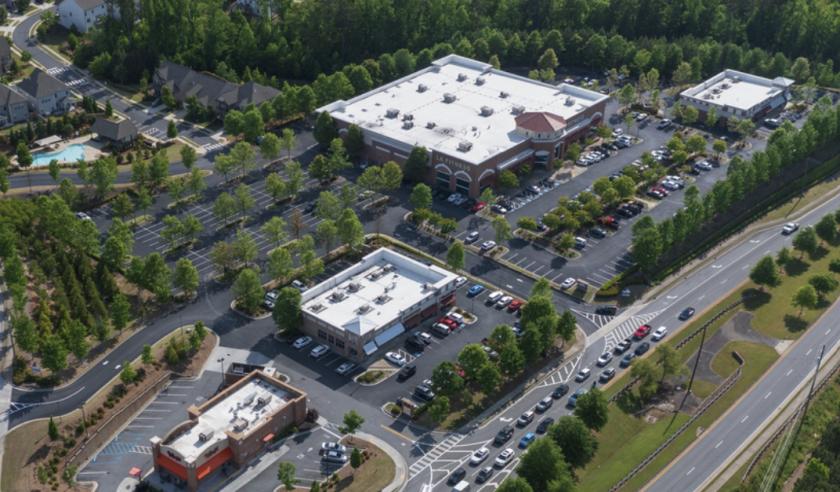
- • GLA 59,722 SF
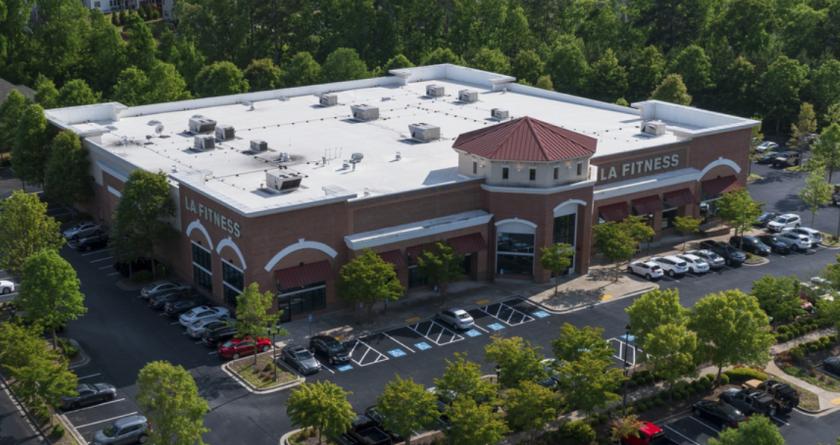
- • Anchored by a high-traffic LA Fitness
Listing Agents

Brett Fuller
O: 770-955-2434
brett.fuller@tscg.com
O: 770-955-2434
brett.fuller@tscg.com
While we strive to provide the most accurate information, all listing information, and demographic data, is provided by third-parties. As such, MyEListing will not be responsible for the accuracy of the information. It is strongly recommended that you verify all information with the listing agent, and any relevant agencies, prior to making any decisions.