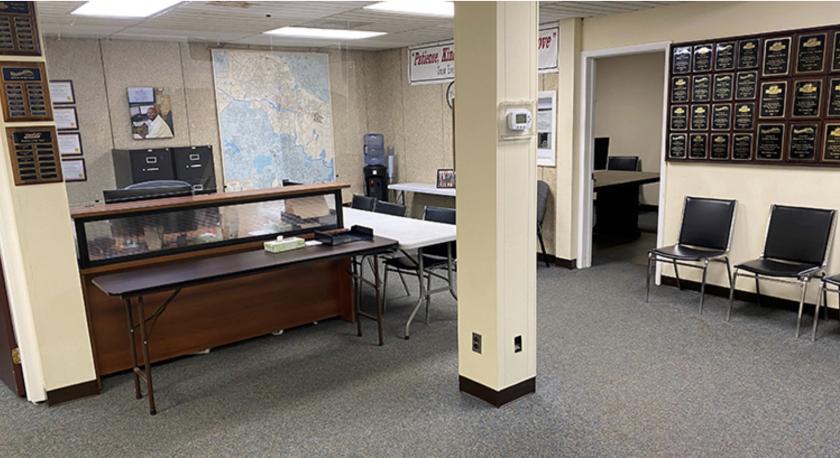
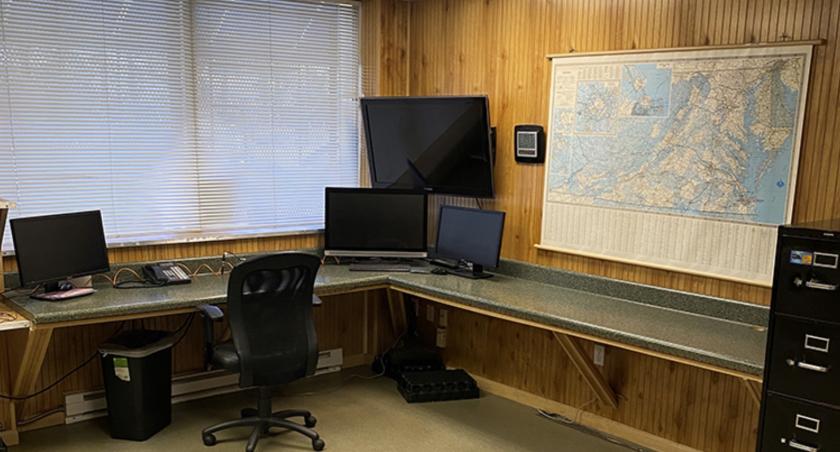
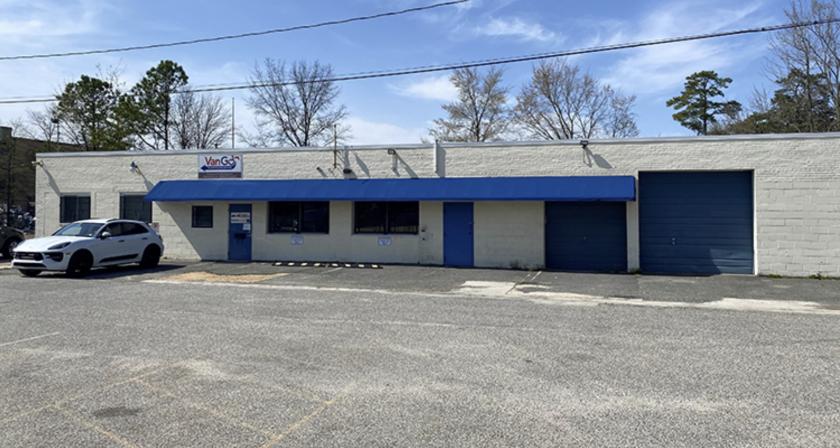
1-Mile | 3-Miles | 5-Miles | ||
---|---|---|---|---|
Total Population | 10,143 | 83,934 | 238,091 | |
Population Median Age | 39 | 39 | 38 | |
Population by Age | 0-9 Yrs | 986 (9%) | 9504 (11%) | 24706 (10%) |
10-19 Yrs | 1172 (11%) | 8581 (10%) | 27622 (11%) | |
20-29 Yrs | 1452 (14%) | 12307 (14%) | 43645 (18%) | |
30-39 Yrs | 1960 (19%) | 14215 (16%) | 36913 (15%) | |
40-49 Yrs | 1443 (14%) | 10771 (12%) | 27051 (11%) | |
50-59 Yrs | 1202 (11%) | 10413 (12%) | 28843 (12%) | |
60-69 Yrs | 1021 (10%) | 8719 (10%) | 25471 (10%) | |
70+ Yrs | 907 (8%) | 9424 (11%) | 23840 (10%) | |
Median HH Income | $52,631 | $60,799 | $63,377 | |
Total Household Income | < 24K | 715 (16%) | 6407 (17%) | 17676 (18%) |
25-49K | 1337 (31%) | 8711 (24%) | 21564 (22%) | |
50-74K | 814 (18%) | 6232 (17%) | 16835 (17%) | |
75-99K | 417 (9%) | 4379 (12%) | 12051 (12%) | |
100-199K | 908 (21%) | 7883 (21%) | 21095 (21%) | |
200K+ | 101 (2%) | 2387 (6%) | 7447 (7%) | |
Highest Education Level | No Diploma | 1181 | 6323 | 14975 |
Diploma or GED | 1888 | 11945 | 31460 | |
Some College | 1580 | 11521 | 31856 | |
Assoc. Degree | 349 | 3853 | 10362 | |
Bachelors Degree | 1356 | 16490 | 47433 | |
Higher Degree | 1001 | 10859 | 30694 | |
Total Housing Units | 4,542 | 38,710 | 104,841 | |
--Owner-Occupied | 2,238 | 19,692 | 52,810 | |
--Renter-Occupied | 2,052 | 16,306 | 43,859 | |
Owner-Occupied Values | < 100K | 203 | 750 | 2631 |
100-199K | 1323 | 6807 | 14808 | |
200-299K | 583 | 6418 | 16775 | |
300-399K | 107 | 2618 | 7916 | |
400-499K | 9 | 1275 | 3876 | |
500K+ | 14 | 1824 | 6803 | |
Total Working Age Population | 8,320 | 69,008 | 199,243 | |
In Work Force | 6,227 | 48,944 | 137,960 | |
Not In Work Force | 2,093 | 20,065 | 61,283 | |
Workforce Employed | 5,885 | 46,513 | 130,231 | |
Workforce Unemployed | 343 | 2,279 | 7,212 | |
Civlian Workforce | 6,227 | 48,792 | 137,444 | |
Military Workforce | 0 | 152 | 516 | |
Total Households | 4,291 | 35,998 | 96,669 | |
Family Households | 2,365 | 18,523 | 51,121 | |
Non-Family Households | 1,926 | 17,475 | 45,548 | |
Married Couple | 1,485 | 12,676 | 34,997 | |
Other Family | 880 | 5,847 | 16,123 | |
Married w/Child | 551 | 5,188 | 12,988 | |
Single Male w/Child | 70 | 530 | 1,790 | |
Single Female w/Child | 377 | 2,334 | 6,041 |
Population Change Last Two Decades - Plus Projection
2000 | % | 2010 | % | 2020 | % | 2030 | |
---|---|---|---|---|---|---|---|
Virginia | 7,078,515 | +13 | 8,001,024 | +8 | 8,655,021 | +8 | 9,331,666 |
Chesterfield County | 259,903 | +22 | 316,236 | +12 | 353,841 | +12 | 396,647 |
Hanover County | 86,320 | +16 | 99,863 | +9 | 109,244 | +9 | 119,360 |
Henrico County | 262,300 | +17 | 306,935 | +8 | 332,103 | +9 | 363,259 |
Richmond city | 197,790 | +3 | 204,214 | +14 | 232,533 | +6 | 245,483 |
Total Working Age Population:
Total Households:
Total Working Age Population:
Total Households:
Total Working Age Population:
Total Households: