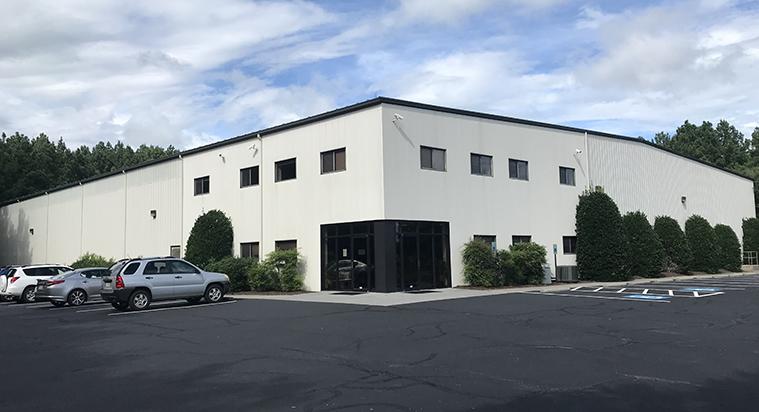
Rare opportunity to own or lease a quality freestanding building
Excellent location just one mile from I-295Rt. 460
Near entrance to leading industrial area be neighbors with Amazon, Food Lion, Ft. Lee Army Logistics
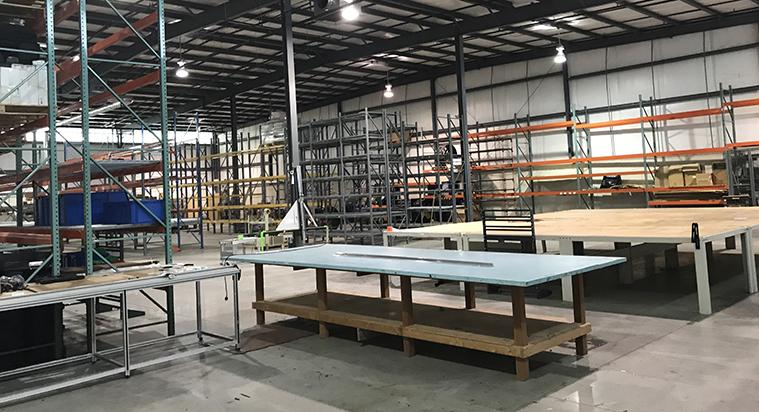
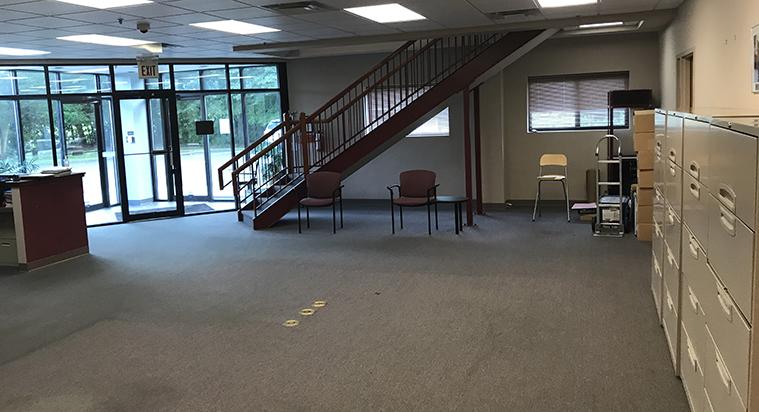
32,500 SF Total Building including 5,000 SF office can be subdivided to approx. 17,000 SF with 2,500 SF office
Functional, attractive, modern facility with exterior signage available Includes showroom, lunchroom, BRs, offices
19 24 ceiling heights two docks 8 x 8 and two drive-ins 12 x 16
Other features small outside yard area, ample parking, 440 v electric, shared compressor, sprinklered
Zoned M-1 light industrial up to 8 acres
FLEXIBLE LEASE TERMS Asking $6.25 psf NNN short or long term lease available
SALE PRICE $2,250,000
No part of this information may be copied, reproduced, repurposed, or screen-captured for any commercial purpose without prior written authorization from MyEListing.
While we strive to provide the most accurate information, all listing information, and demographic data, is provided by third-parties. As such, MyEListing will not be responsible for the accuracy of the information. It is strongly recommended that you verify all information with the listing agent, and any relevant agencies, prior to making any decisions.
What is the asking price for 4740 Chudoba Parkway in Prince George?
The asking price for 4740 Chudoba Parkway is $6.25 a SF per Year
What is the building size of this commercial Flex/Office Whs property?
The size of this lease property at '.4740 Chudoba Parkway.' is 32380 square feet
What is the population within 1 mile of 4740 Chudoba Parkway in Prince George?
The population within 1 mile of 4740 Chudoba Parkway Prince George, VA 23875 is 624 people.
Who do I contact for questions about 4740 Chudoba Parkway?
You should contact the listing agent,
David Williams, for any details regarding this commercial listing.