Flex-Office-Warehouse
711 Hospital Street Richmond, VA 23219
711 Hospital Street Richmond, VA 23219

Details & Description
Property Highlights
- • Zoned M-2
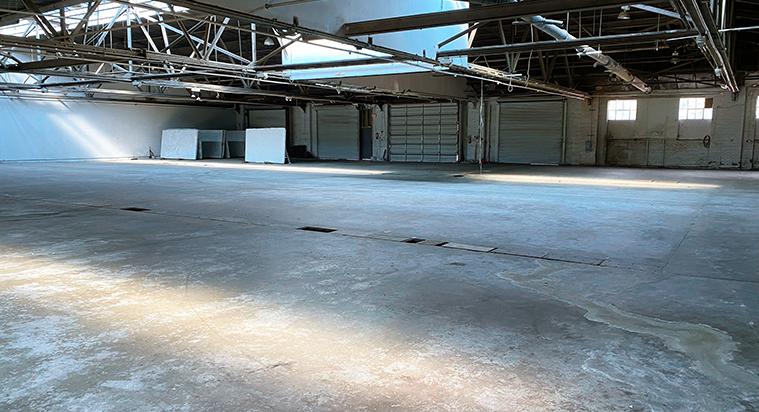
- • 2,000 SF of office space
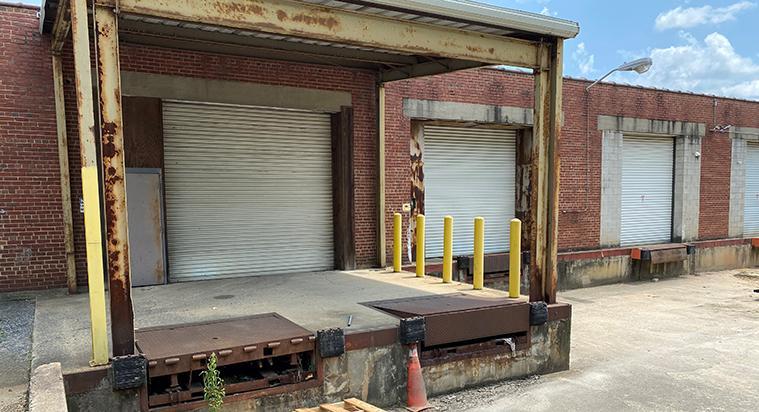
- • Oversized 16 x 12 drive in door
- • 12 6 ceiling height
- • Floor drains
- • Existing paint booth in place
Listing Agents

Ben Bruni
O: 804-793-0046
bbruni@commonwealthcommercial.com
O: 804-793-0046
bbruni@commonwealthcommercial.com

Russell Wyatt
O: 804-433-1817
rwyatt@commonwealthcommercial.com
O: 804-433-1817
rwyatt@commonwealthcommercial.com
While we strive to provide the most accurate information, all listing information, and demographic data, is provided by third-parties. As such, MyEListing will not be responsible for the accuracy of the information. It is strongly recommended that you verify all information with the listing agent, and any relevant agencies, prior to making any decisions.