Commercial Land
5310 East 900 North Fair Oaks, IN 47943
5310 East 900 North Fair Oaks, IN 47943
Details & Description
Property Highlights
• Additionally, 9.6 Million Households Intend to Buy an RV Within the Next Five Years
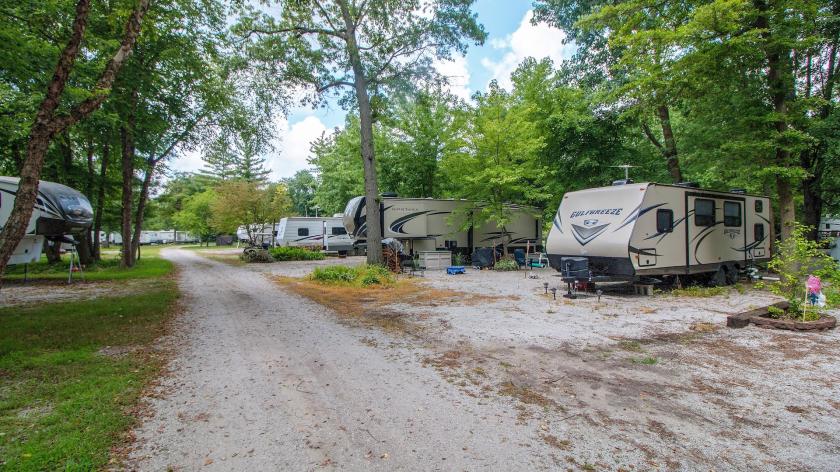
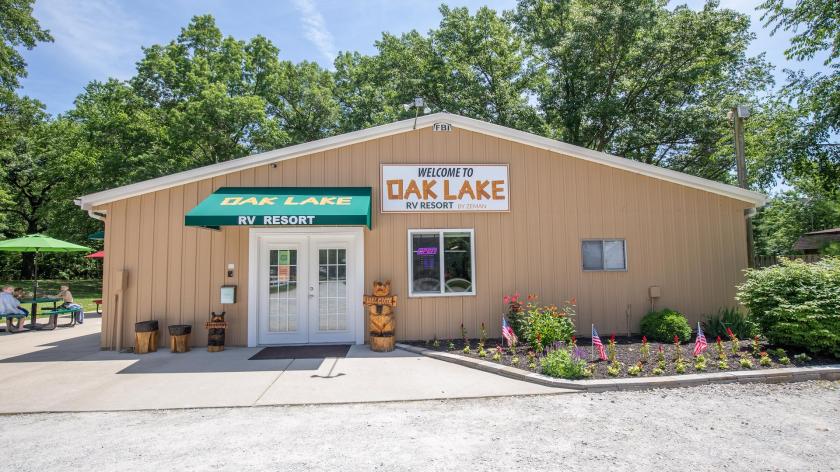
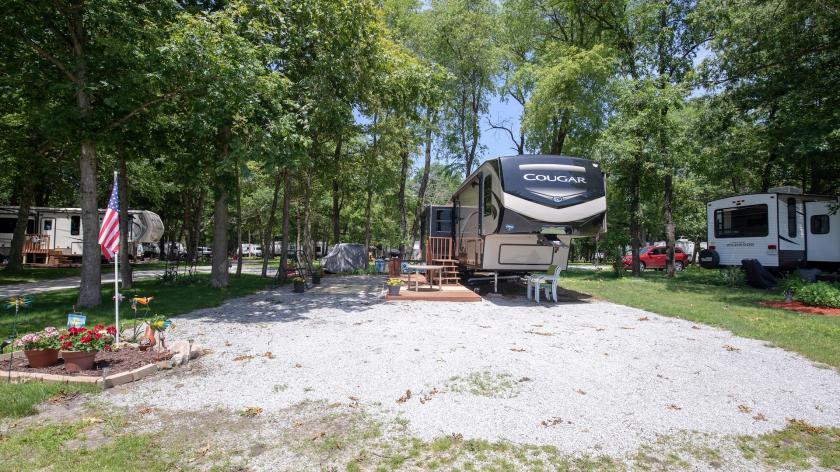
• Opportunity to Acquire an RV Portfolio in Illinois and Indiana
Listing Agents

Kyle Baskin
O: 216-264-2059
kyle.baskin@marcusmillichap.com
O: 216-264-2059
kyle.baskin@marcusmillichap.com

Michael DiCillo Jr.
Marcus & Millichap
O: 216-264-2034
michael.dicillo@marcusmillichap.com
Marcus & Millichap
O: 216-264-2034
michael.dicillo@marcusmillichap.com

Jonathon McClellan
Marcus & Millichap
O: 216-264-2023
jonathon.mcclellan@marcusmillichap.com
Marcus & Millichap
O: 216-264-2023
jonathon.mcclellan@marcusmillichap.com
While we strive to provide the most accurate information, all listing information, and demographic data, is provided by third-parties. As such, MyEListing will not be responsible for the accuracy of the information. It is strongly recommended that you verify all information with the listing agent, and any relevant agencies, prior to making any decisions.