Commercial Land
104 M P Drive Stoneville, NC 27048
104 M P Drive Stoneville, NC 27048
Details & Description
Property Highlights
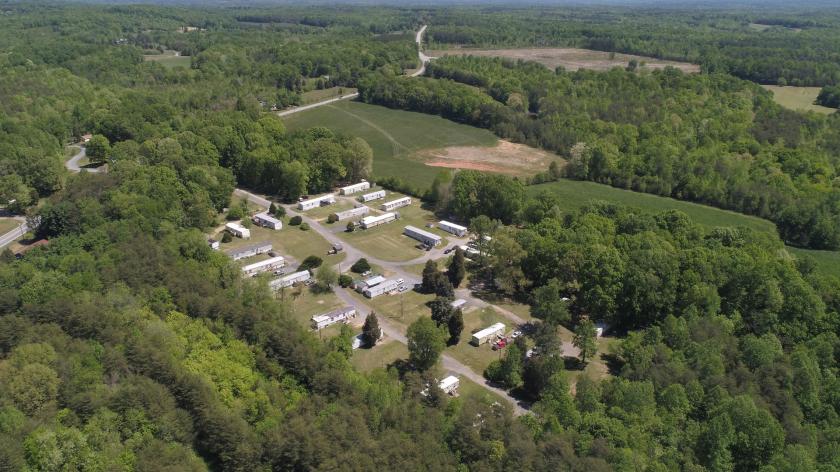
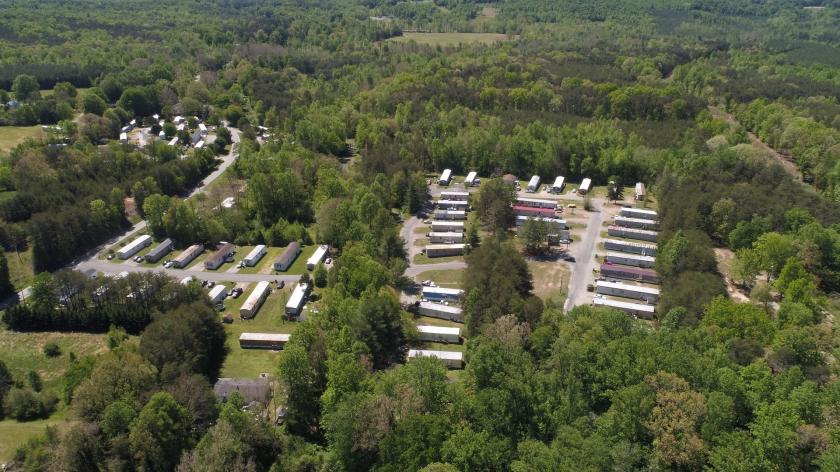
• Opportunity to acquire two manufactured housing communities located in North Carolina
• The communities contain 87 total sites that are 92 percent occupied
Listing Agents

Kyle Baskin
O: 216-264-2059
kyle.baskin@marcusmillichap.com
O: 216-264-2059
kyle.baskin@marcusmillichap.com

Michael DiCillo Jr.
Marcus & Millichap
O: 216-264-2034
michael.dicillo@marcusmillichap.com
Marcus & Millichap
O: 216-264-2034
michael.dicillo@marcusmillichap.com

Jonathon McClellan
Marcus & Millichap
O: 216-264-2023
jonathon.mcclellan@marcusmillichap.com
Marcus & Millichap
O: 216-264-2023
jonathon.mcclellan@marcusmillichap.com
While we strive to provide the most accurate information, all listing information, and demographic data, is provided by third-parties. As such, MyEListing will not be responsible for the accuracy of the information. It is strongly recommended that you verify all information with the listing agent, and any relevant agencies, prior to making any decisions.