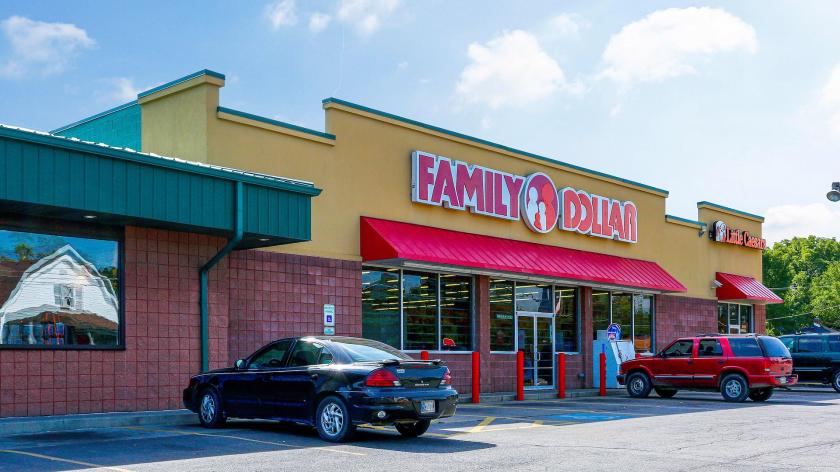
Marcus & Millichap, on behalf of ownership, is pleased to present for sale, Family Dollar & Little Caesars, a 100 percent occupied, two-tenant strip center located in Indianapolis, Indiana. The subject property was built in 2007, measures 10,600 square feet and is situated on 1.31 acres. Family Dollar is the sites largest tenant and currently occupies 9,000 square feet which accounts for 85 percent of the building. Family Dollar was the catalyst for the site’s development, having signed a lease prior to construction. Family Dollar has shown deep commitment and success at the site since, and just exercised their option to extend a full year early. Family Dollar is currently paying very reasonable rent of $10.62 per square foot and is the only Family Dollar or Dollar Tree within a two-mile radius. Family Dollar’s lease is guaranteed by parent company Dollar Tree, who is currently ranked #131 on the Fortune 500, holds investment grade credit by Moody’s (Baa2) and is traded on the NASDAQ under ticker symbol (DLTR). Little Caesars occupies the remaining 15 percent of gross leasable area and also just renewed their lease a full year early, showing achievement and promise to the site. Little Caesar’s is an original tenant from construction, signed an initial five-year lease, and has now exercised three options at the site. Both tenants are encumbered by triple-net leases wherein landlord receives full reimbursement of tax, common area maintenance, insurance and management expenses. Landlord benefits from ease of management with only two national tenants, long-term historical tenancy, favorable lease structures and irreplaceable real estate. Family Dollar & Little Caesars has a prime location with strong frontage along Shelby Street, and is situated near the hard corner of Shelby and Raymond, which is just off Interstate-65. The adjacent hard corner sees over 45,000 vehicles per day and Interstate-65 sees over 100,000 vehicles per day. Accompanying the strong vehicle counts are dense and mature demographics with population counts of 16,573 within one-mile, 94,083 within three-miles and 224,232 within five-miles. Average household income is around the national average at $45,000, $55,000 and $56,000 respectively, which cater extremely well to the tenant base. Retailers in the immediate vicinity include CVS, Safeway, Dollar General, and White Castle. The subject property is in the southern region of Indianapolis and just two-miles south of downtown. Indianapolis is the 33rd largest Metro in the United State and is the state capital of Indiana. The Indianapolis MSA has a population count of over $2.075 million and has almost seen double digit growth since 2010. Indy is home to major corporations such as Anthem, Eli Lilly and Company, Guidant, Simon Property Group, and houses major professional sports such as the Indianapolis Colts and the Indiana Pacers.Family Dollar and Little Caesar's Both Just Renewed Leases a Full Year Early | Now Run Through 2027 | Original Tenants Since Construction.Family Dollar was Catalyst for Construction | Meticulous Site Selection Prior to Construction | 85 Percent of Gross Leasable Area and 70 Percent of Base Rental Income.Family Dollar Location Ranks 98th Percentile in United States for Foot-Traffic Via Placer.Ai | Only Location Within a Few Mile Radius.Ease of Management: Only Two Tenants; Triple-Net Leases Covering Tax/Common Area Maintenance/Insurance and Management Fees.Irreplaceable Real Estate | Adjacent to Hard Corner with Over 45,000 Vehicles per Day | Directly Off Interstate-65 with Over 100,000 Vehicles per Day.Dense and Mature Demographics with Population Counts of 16,573 Within One-Mile, 94,083 Within Three-Miles and 224,232 Within Five-Miles.