Retail Space
4322 Tuscarawas Street West Canton, OH 44708
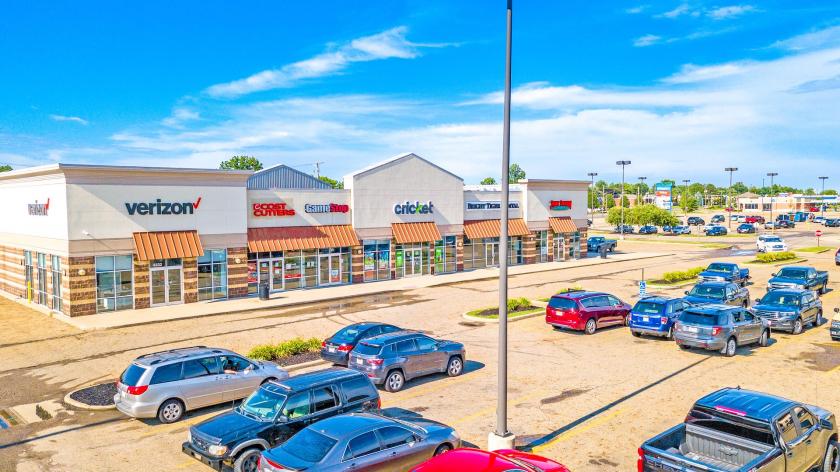
4322 Tuscarawas Street West Canton, OH 44708
Details & Description
Property Highlights
• Offers 9.8 Percent Cash-on-Cash Return and 15.6 Percent Total Return at Proposed Financing Terms
• Anchored by National Retailers Verizon and Penn Station Subs on the Endcaps, Six Units Total
Listing Agents

Craig Fuller
O: 216-264-2043
cfuller@ipausa.com
O: 216-264-2043
cfuller@ipausa.com

Scott Wiles
Marcus & Millichap
O: 216-264-2026
swiles@ipausa.com
Marcus & Millichap
O: 216-264-2026
swiles@ipausa.com

Eric Patton
Marcus & Millichap
O: 614-360-9035
epatton@ipausa.com
Marcus & Millichap
O: 614-360-9035
epatton@ipausa.com
While we strive to provide the most accurate information, all listing information, and demographic data, is provided by third-parties. As such, MyEListing will not be responsible for the accuracy of the information. It is strongly recommended that you verify all information with the listing agent, and any relevant agencies, prior to making any decisions.