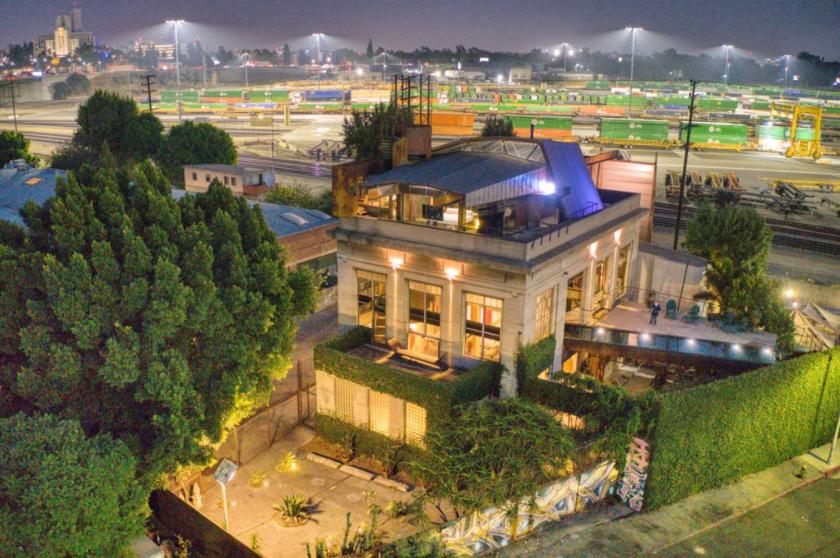
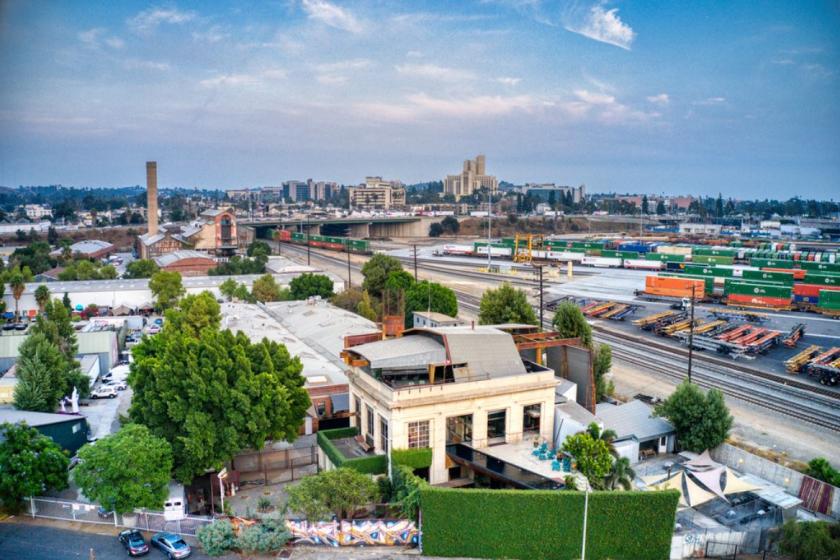
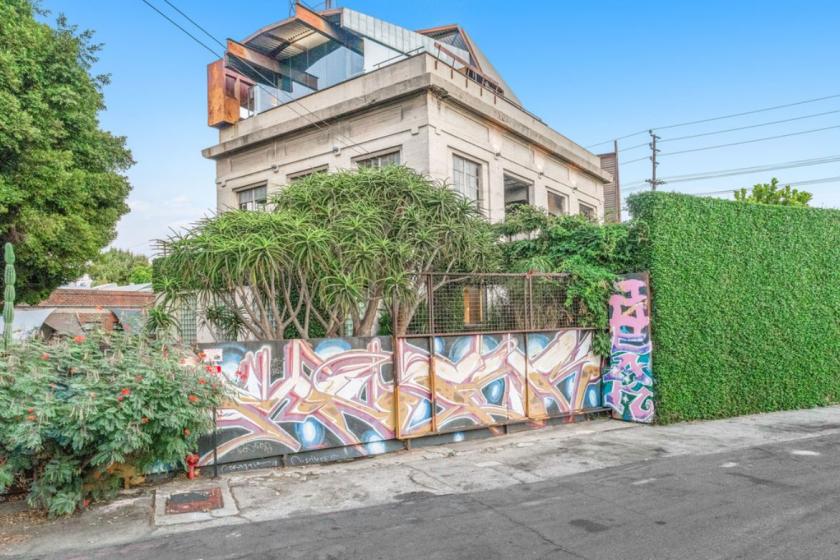
1-Mile | 3-Miles | 5-Miles | ||
---|---|---|---|---|
Total Population | 35,326 | 364,603 | 1,062,627 | |
Population Median Age | 36 | 36 | 36 | |
Population by Age | 0-9 Yrs | 3152 (8%) | 39988 (10%) | 123979 (11%) |
10-19 Yrs | 4374 (12%) | 43169 (11%) | 130141 (12%) | |
20-29 Yrs | 7840 (22%) | 69714 (19%) | 196903 (18%) | |
30-39 Yrs | 5683 (16%) | 63862 (17%) | 180991 (17%) | |
40-49 Yrs | 5496 (15%) | 49473 (13%) | 143178 (13%) | |
50-59 Yrs | 3638 (10%) | 39095 (10%) | 117986 (11%) | |
60-69 Yrs | 2506 (7%) | 29982 (8%) | 88197 (8%) | |
70+ Yrs | 2637 (7%) | 29320 (8%) | 81252 (7%) | |
Median HH Income | $41,535 | $47,225 | $48,856 | |
Total Household Income | < 24K | 2440 (29%) | 36305 (29%) | 94101 (26%) |
25-49K | 2453 (29%) | 26435 (21%) | 83940 (24%) | |
50-74K | 1301 (15%) | 18250 (15%) | 56161 (16%) | |
75-99K | 909 (10%) | 12554 (10%) | 37355 (10%) | |
100-199K | 1107 (13%) | 20970 (17%) | 58416 (16%) | |
200K+ | 170 (2%) | 6671 (5%) | 19599 (5%) | |
Highest Education Level | No Diploma | 10042 | 88160 | 234619 |
Diploma or GED | 5678 | 49021 | 143893 | |
Some College | 3612 | 38045 | 108574 | |
Assoc. Degree | 1063 | 12134 | 38221 | |
Bachelors Degree | 2798 | 44086 | 135665 | |
Higher Degree | 946 | 19323 | 58672 | |
Total Housing Units | 8,934 | 130,493 | 377,502 | |
--Owner-Occupied | 1,601 | 28,053 | 84,471 | |
--Renter-Occupied | 6,779 | 93,133 | 265,100 | |
Owner-Occupied Values | < 100K | 39 | 459 | 1387 |
100-199K | 32 | 468 | 1447 | |
200-299K | 245 | 1915 | 4286 | |
300-399K | 213 | 4447 | 10955 | |
400-499K | 296 | 5521 | 13261 | |
500K+ | 776 | 15242 | 53136 | |
Total Working Age Population | 29,676 | 298,339 | 864,549 | |
In Work Force | 13,604 | 186,054 | 564,882 | |
Not In Work Force | 16,072 | 112,285 | 299,666 | |
Workforce Employed | 12,625 | 172,400 | 523,954 | |
Workforce Unemployed | 979 | 13,583 | 40,734 | |
Civlian Workforce | 13,604 | 185,984 | 564,688 | |
Military Workforce | 0 | 71 | 194 | |
Total Households | 8,380 | 121,186 | 349,571 | |
Family Households | 5,686 | 67,386 | 207,958 | |
Non-Family Households | 2,695 | 53,801 | 141,613 | |
Married Couple | 3,280 | 39,266 | 122,709 | |
Other Family | 2,405 | 28,119 | 85,249 | |
Married w/Child | 1,474 | 16,012 | 52,552 | |
Single Male w/Child | 206 | 3,654 | 11,400 | |
Single Female w/Child | 848 | 8,958 | 25,947 |
Population Change Last Two Decades - Plus Projection
2000 | % | 2010 | % | 2020 | % | 2030 | |
---|---|---|---|---|---|---|---|
California | 33,871,648 | +10 | 37,253,956 | +9 | 40,467,295 | +8 | 43,631,295 |
Los Angeles County | 9,519,338 | +3 | 9,818,605 | +6 | 10,369,367 | +4 | 10,759,850 |
Total Working Age Population:
Total Households:
Total Working Age Population:
Total Households:
Total Working Age Population:
Total Households: