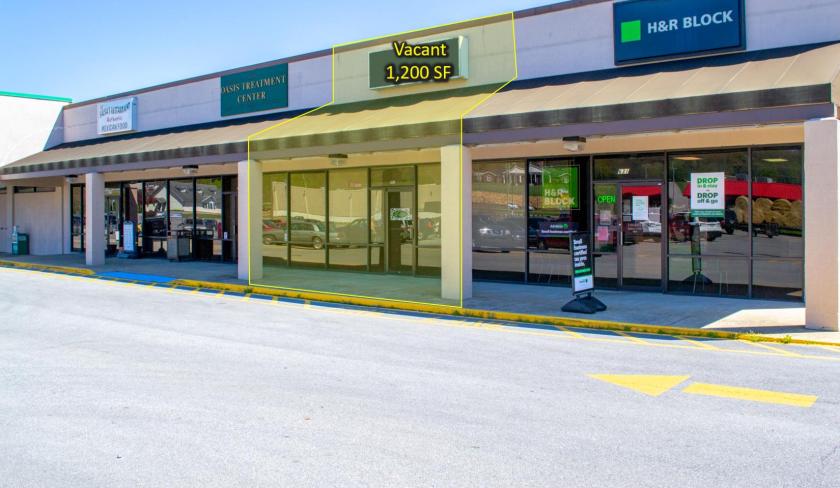
Retail Space
615 Asheville Highway Greeneville, TN 37743
615 Asheville Highway Greeneville, TN 37743

Details & Description
Property Highlights
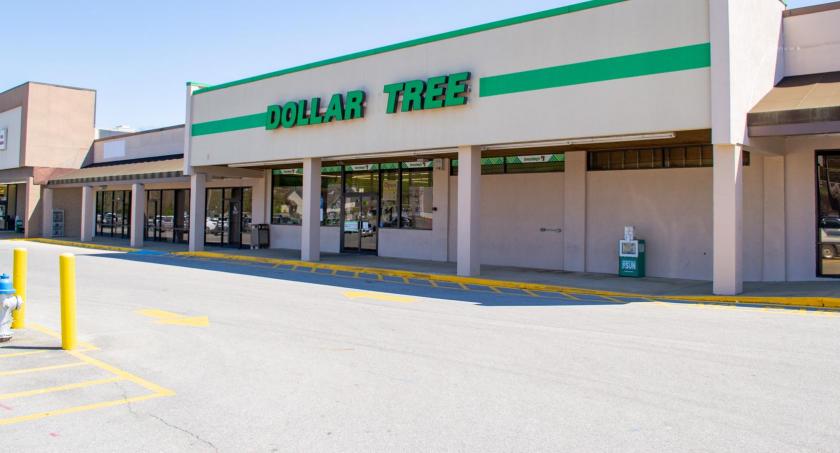
• Grocery Anchor and Dollar Tree Recently Signed Lease Extensions Showing Strong Commitment to the Center
• 40 Percent Median Household Income Growth Since 2000 with Over 10 Percent Growth Projected by 2025
Listing Agents

Joel Dumes
O: 513-878-7720
joel.dumes@marcusmillichap.com
O: 513-878-7720
joel.dumes@marcusmillichap.com

Stan Falk
Marcus & Millichap
O: 513-878-7721
stanton.falk@marcusmillichap.com
Marcus & Millichap
O: 513-878-7721
stanton.falk@marcusmillichap.com
While we strive to provide the most accurate information, all listing information, and demographic data, is provided by third-parties. As such, MyEListing will not be responsible for the accuracy of the information. It is strongly recommended that you verify all information with the listing agent, and any relevant agencies, prior to making any decisions.