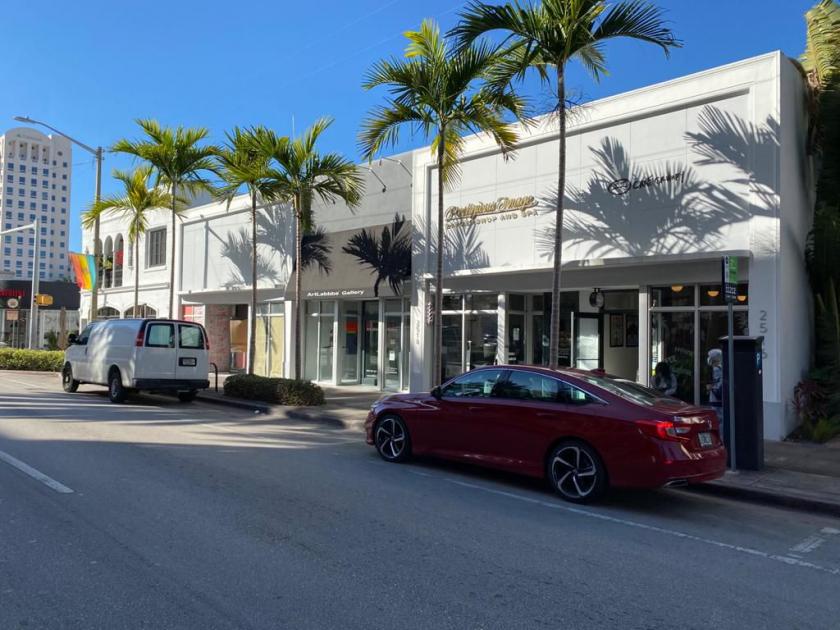
Retail Space
2516 Ponce de Leon Coral Gables, FL 33134
2516 Ponce de Leon Coral Gables, FL 33134
Details & Description
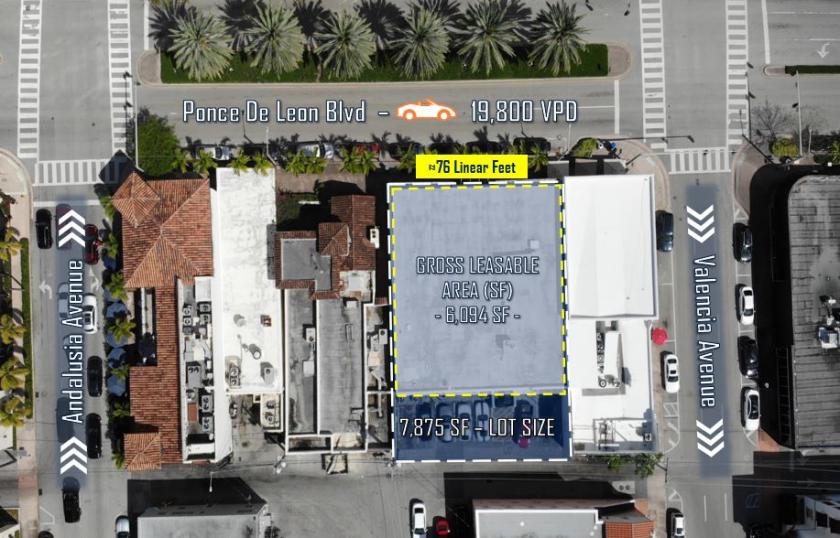
Property Highlights
- • 1 Block South from Miracle Mile
- • Brand New Grease Trap Installed
- • All Small Bay, Service Driven Retail Tenants
Listing Agents

Jonathan De La Rosa
O: 786-522-7027
jonathan.delarosa@marcusmillichap.com
O: 786-522-7027
jonathan.delarosa@marcusmillichap.com
While we strive to provide the most accurate information, all listing information, and demographic data, is provided by third-parties. As such, MyEListing will not be responsible for the accuracy of the information. It is strongly recommended that you verify all information with the listing agent, and any relevant agencies, prior to making any decisions.